1994issue C081-16
Repeated option-premium prints and a four-zone regime map
A single put-versus-call premium reading was treated as incomplete. The historical workflow waited for the same option-premium ratio to reappear, then placed that stall below the median, above it, near it with index drift, or at an extreme inversion.
- The option-premium ratio compares listed put price premiums with call price premiums. It is a crowd-pricing gauge, not a contract-count put-call tally. Two matching daily prints were treated as a stall in equity-market sentiment.
- Matching prints in the 0.40 to 0.54 area were followed by industrial-average advances in the case tables. Documented matching bands well above the median were followed by declines.
- Near the median, consecutive matching prints were read with the industrial average's own two-day change, not as a standalone contrarian cue.
- At very high and very low extremes the usual advance-and-decline map inverted, with one thin three-case exception for prints above 0.92 separated by one session.
A stall, not a one-day blip
The option-premium ratio compares listed put price premiums with call price premiums. It is used as a crowd-pricing gauge rather than a contract-count put-call tally. In the historical workflow, one daily print was not treated as a finished reading. Two matching daily values, consecutive or separated by as many as seven sessions, were treated as a repeated identical print: a sign that equity-market sentiment had held still.
The sample range and the median reference
In the sample from 1986, daily ratio values ran from 0.03 to 1.74. Prints below 0.29 appeared only in bear markets. Prints above 1.18 appeared only on strong bull legs. Most values sat between 0.29 and 1.18, and the median reference stayed in the low to mid-0.60s. A stall was then judged cheap, rich, or neutral against that center.
Below-median and above-median clusters
Matching readings in the 0.40 to 0.54 area, back to back or spaced by one to seven sessions in the documented sub-bands, were followed by significant industrial-average advances in the case tables. More than half of the two-to-seven-day-gap cases climbed over 149 points. That is the below-median cluster: matching prints well under the median, historically associated with later advances except at crash-level extremes.
Matching readings well above the median form the above-median cluster. Consecutive prints from 0.70 to 0.77, prints from 0.78 to 0.86 three or four days apart, and prints from 0.80 to 0.88 five to seven days apart were followed by significant industrial-average declines in the case tables, except at euphoric extremes.
DJIA point moves after identical 0.70–0.77 premium-ratio stalls
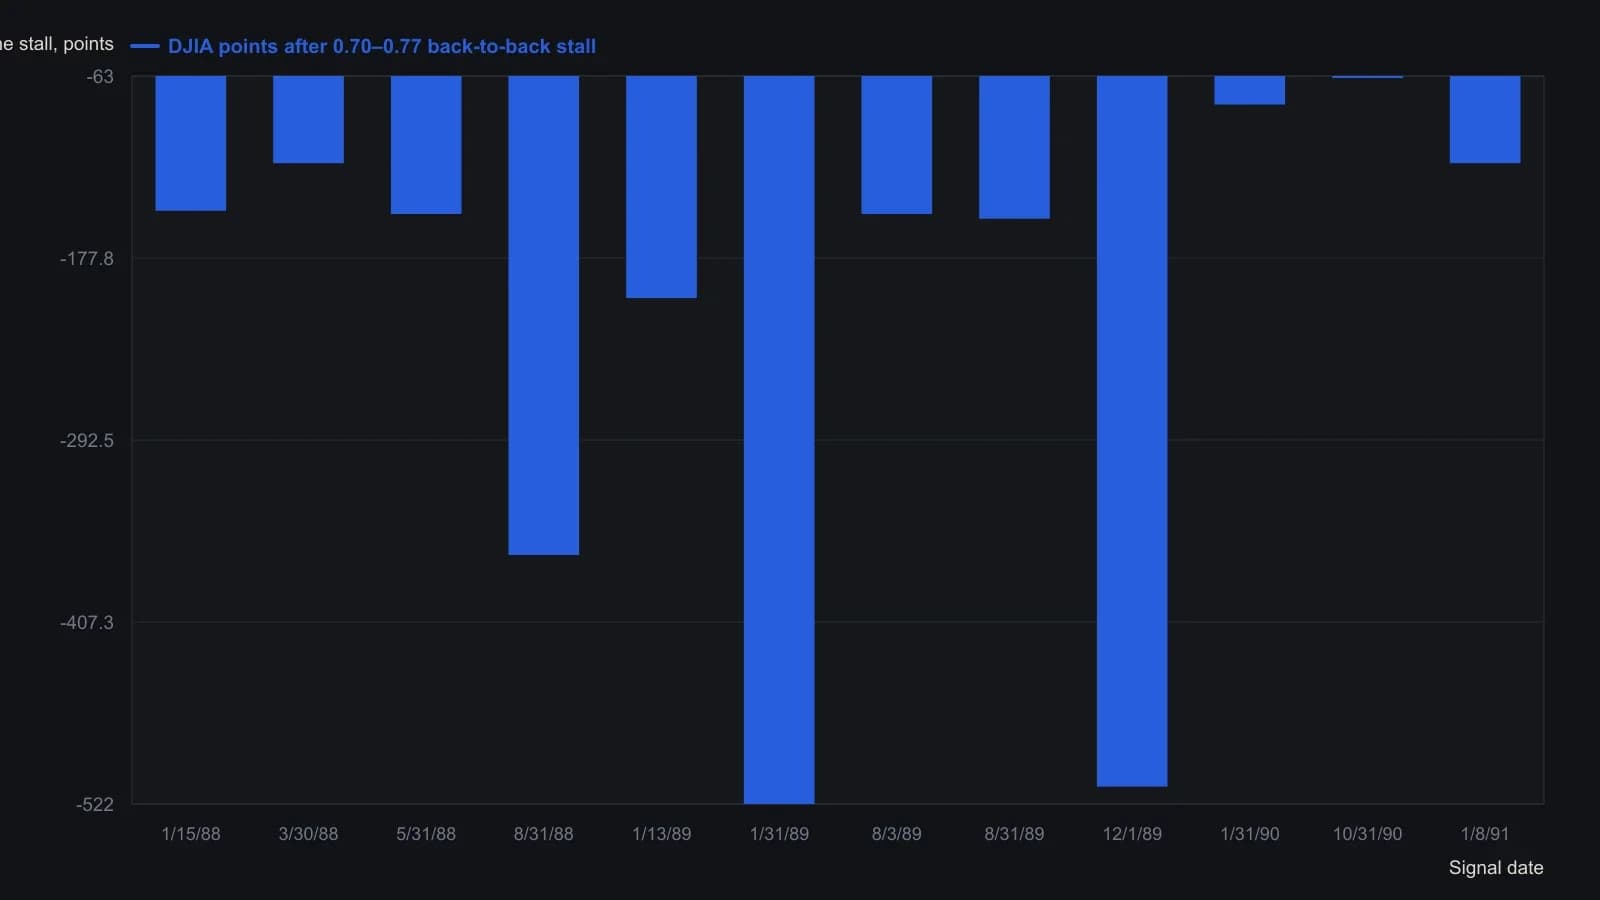
Cadbury restricted this cluster to identical back-to-back prints only; one-day or multi-day separations in the same 0.70s band are treated as a weaker, non-universal setup in the surrounding text.
Near-median confirmation
Near the median, consecutive matching prints were not read on their own. They were paired with the industrial average's own two-day change. A rise of more than 5 points with matching prints from 0.61 to 0.66 accompanied further advances. Matching prints from 0.63 to 0.67 without that rise accompanied later declines, with a median loss of 127 points in the latter group.
When the usual map inverted
At extremes the usual map inverted. Consecutive matching prints above 0.88 were followed by advances of more than 100 industrial-average points. Consecutive matching prints under 0.30 were followed by a short bounce and then declines of about 200 points.
Matching prints above 0.92 separated by one session were followed by declines of nearly 200 industrial-average points or more. That pattern rested on three recorded cases. It sits beside the consecutive high-extreme band rather than replacing it.
Editorial reading for a single equity idea
Editorial interpretation: a repeated identical print is only the first step. The stall still has to be placed on a four-zone regime map: below-median cluster, above-median cluster, near-median confirmation with index drift, or extreme inversion.
TradersWeek treats that stamp as a contrarian regime filter. It converts the premium mix into a market-regime context so a single equity idea can be aligned with crowd pricing, faded against it, or withheld, on a weeks-to-months horizon. That use is editorial. The archive described the historical workflow and the case tables. It did not assign a present-day trade.
All readings on this track · 31 readings
- 1989Constructing an open-interest-scaled put-call ratio
- 1990Open-interest put/call ratio as an intermediate sentiment overlay
- 1990Activity-weighted call-put ratio for options regime context
- 1990Stacking moving averages, put-call regimes, and double bottoms
- 1991Constructing put-call open-interest regime filters
- 1991Constructing an activity-weighted call-put sentiment reading
- 1991Fund-index regime, put-call confirmation, then the tracking fund
- 1992A seven-vote sentiment score for fund-sleeve regimes
- 1992Construct an activity-weighted call-put ratio before reading crowd conviction
- 1992Pair action with opinion in a composite sentiment index
- 1992Crowd extremes as a three-gate contrary procedure
- 1993Constructing a put-volume average regime filter
- 1993Neural-net inputs and rule trees for mechanical systems
- 1994Failed Treasury put-call signal and a dollar regime shift
- 1994Separate survey, put-call, and premium ledgers before a regime call
- 1994Repeated option-premium prints and a four-zone regime map
- 1995Consecutive-day regimes in the put-call premium ratio
- 1995Construct a put-call ratio for regime-aware contrarian signals
- 1996Treat one options idea as a regime-aware portfolio decision
- 1997Options open interest, put-call sentiment, and contrarian context
- 2000A two-layer put-call construction for intermediate market conditions
- 2002Sentiment confirmation for trend-following options
- 2003Construct a regime overlay from implied volatility and the put-call ratio
- 2004Dollar-weighted Put-call ratio construction
- 2006Debit put spreads inside put-call regimes
- 2011Put-call ratio cycle phases for index context
- 2011Constructing a put-call ratio cycle indicator
- 2011Building a put-call ratio indicator stack
- 2011Put-call ratio regime context with oscillator and band confirmation
- 2018Reading seasonal regimes with put-call divergence and bands
- 2020Treat close-only volume as a hypothesis, then choose regime or phase