2011issue C1241-47
Put-call ratio regime context with oscillator and band confirmation
A Put-call ratio reading is treated as weeks-to-months market-regime context only when a Stochastic oscillator and Bollinger Bands independently agree. The archive lesson is a stay-open test across three layers, not a new indicator recipe.
- A Put-call ratio reading is used as market-regime context on a weeks-to-months horizon, not as a self-contained entry signal.
- The archive template stacks an equity-index price series, moving averages, and Bollinger Bands above fast and slow Put-call ratio layers, a transformed slow Put-call ratio series, and a Stochastic oscillator.
- A long setup waits for the fast Put-call ratio to turn down after a top while price is still falling or flat, with the slow Put-call ratio topping and the transformed slow series confirming.
- Editorial reading: a trade is allowed to stay open only while Put-call ratio context, oscillator location, and band structure still agree.
Regime context is a stay-open rule
The archive presents a charting template that places an equity-index price series with simple moving averages and Bollinger Bands above fast and slow Put-call ratio indicators, the inverse Fisher transform of the slow Put-call ratio, and a Stochastic oscillator. Editorial reading: that stack is not three ways to say the same thing. It is a requirement that options-sentiment context, range location, and a volatility envelope each confirm before a trade is allowed to remain open.
The lesson is therefore not how to draw the indicators. It is how a single Put-call ratio reading becomes weeks-to-months market-regime context only when it is forced to agree with two explicit price-path models: a Stochastic oscillator and Bollinger Bands.
SVE_Stoch_IFT percent gain by stock, 2005–2011
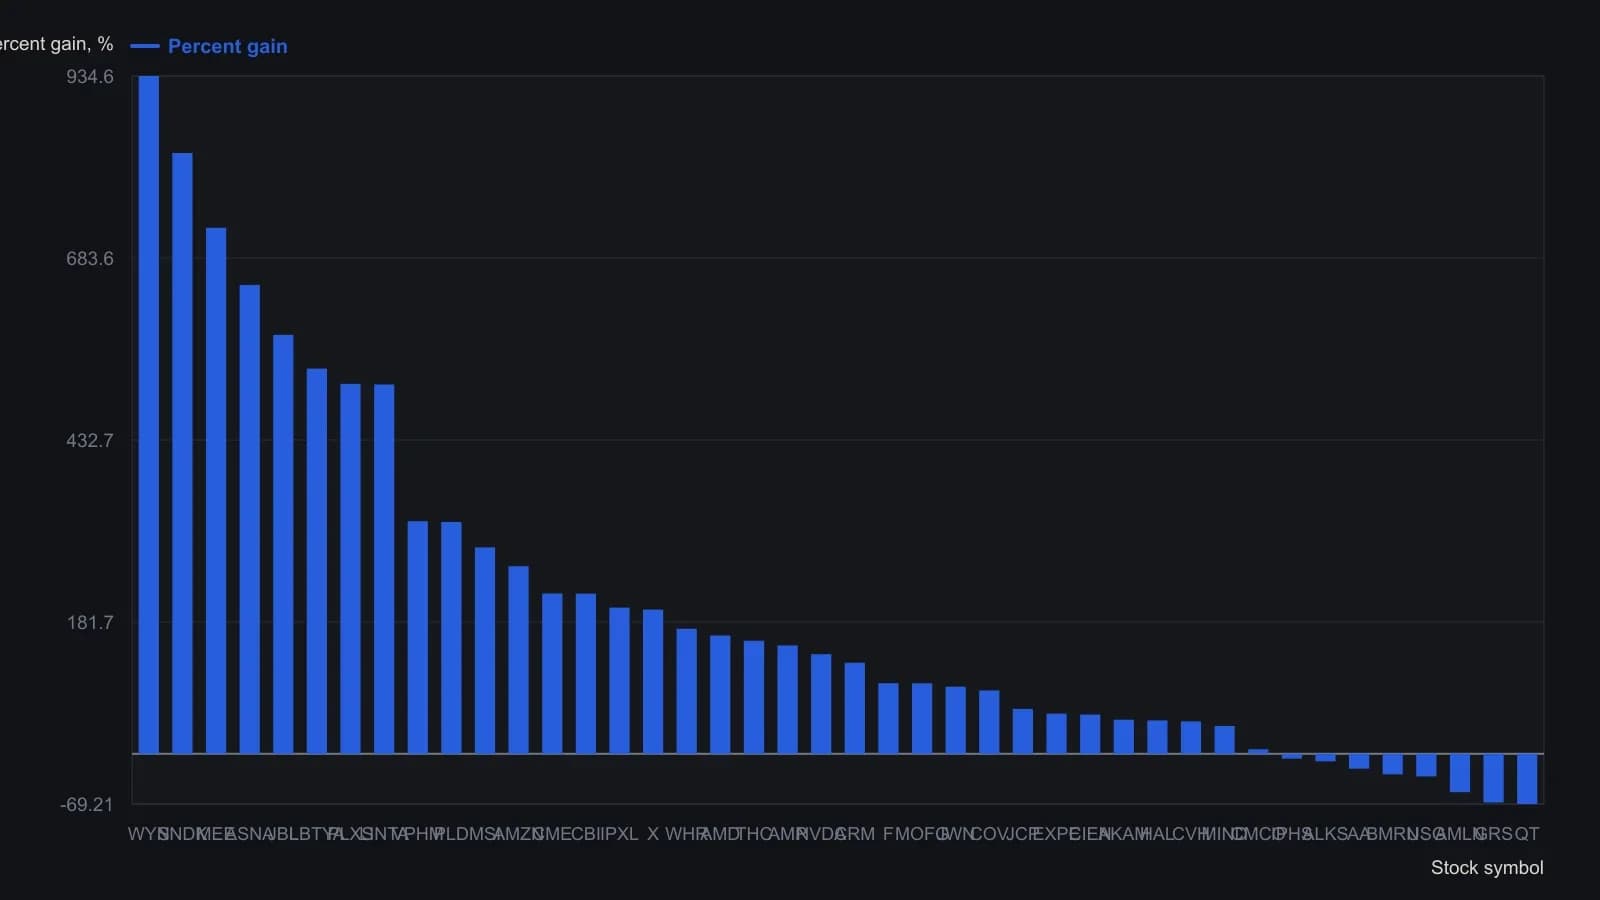
Each name started with $2,500, traded long and short at the signal-day close, and paid 0.002 percent transaction cost, with no profit sharing across names. Longs opened when SVE_Stoch_IFT crossed above 30 and closed when it crossed below 60; shorts used the reverse plus a 165-day simple-average filter. Several tickers begin after May 2005.
How the template places the layers
Bollinger Bands are assigned as the shorter-term dynamic support and resistance layer. The longer moving averages are treated as typical dynamic support and resistance and are used together with trendlines and level breaks in the same price window.
The Stochastic oscillator is first defined as a slowed oscillator, then recomputed on rainbow-weighted short moving averages of the close and mapped through an inverse Fisher transform. The archive uses that transformed series to keep a position open or to force an exit if the other signals fail.
A put-call long setup still needs price confirmation
A Put-call ratio long-entry setup is described as the fast Put-call ratio turning down after a top and a reversal warning while price is still falling or flat, together with the slow Put-call ratio topping and confirmation at the confirming extreme of the inverse Fisher transform of the slow Put-call ratio.
That is still only the sentiment half of the gate. Editorial reading: the price window has to supply the other two confirmations, because the Put-call ratio layers are being asked to classify regime, not to time the trade by themselves.
When the layers stop agreeing
In one illustrated case, an index close through an uptrend line aligned with the Bollinger Bands midline, while the slow Stochastic oscillator had been topping and the inverse-Fisher Stochastic oscillator sat at a confirming extreme. The archive treated that alignment as a reason to take a short-term gain rather than wait for a possible move toward a longer moving average.
Editorial reading: the short-term gain is not the point. The point is that band structure, oscillator location, and the break of a trendline were allowed to override the wish to hold for a farther average.
All readings on this track · 31 readings
- 1989Constructing an open-interest-scaled put-call ratio
- 1990Open-interest put/call ratio as an intermediate sentiment overlay
- 1990Activity-weighted call-put ratio for options regime context
- 1990Stacking moving averages, put-call regimes, and double bottoms
- 1991Constructing put-call open-interest regime filters
- 1991Constructing an activity-weighted call-put sentiment reading
- 1991Fund-index regime, put-call confirmation, then the tracking fund
- 1992A seven-vote sentiment score for fund-sleeve regimes
- 1992Construct an activity-weighted call-put ratio before reading crowd conviction
- 1992Pair action with opinion in a composite sentiment index
- 1992Crowd extremes as a three-gate contrary procedure
- 1993Constructing a put-volume average regime filter
- 1993Neural-net inputs and rule trees for mechanical systems
- 1994Failed Treasury put-call signal and a dollar regime shift
- 1994Separate survey, put-call, and premium ledgers before a regime call
- 1994Repeated option-premium prints and a four-zone regime map
- 1995Consecutive-day regimes in the put-call premium ratio
- 1995Construct a put-call ratio for regime-aware contrarian signals
- 1996Treat one options idea as a regime-aware portfolio decision
- 1997Options open interest, put-call sentiment, and contrarian context
- 2000A two-layer put-call construction for intermediate market conditions
- 2002Sentiment confirmation for trend-following options
- 2003Construct a regime overlay from implied volatility and the put-call ratio
- 2004Dollar-weighted Put-call ratio construction
- 2006Debit put spreads inside put-call regimes
- 2011Put-call ratio cycle phases for index context
- 2011Constructing a put-call ratio cycle indicator
- 2011Building a put-call ratio indicator stack
- 2011Put-call ratio regime context with oscillator and band confirmation
- 2018Reading seasonal regimes with put-call divergence and bands
- 2020Treat close-only volume as a hypothesis, then choose regime or phase