1990issue C011-6
Open-interest put/call ratio as an intermediate sentiment overlay
A historical case study built a put/call ratio from outstanding index-option open interest, smoothed it with a 10-day moving average, and treated rare extreme-and-reversal readings as an intermediate overlay to weigh with other technical evidence.
- A put/call ratio can be built from outstanding index-option open interest instead of from traded volume or dollar premium, so the reading tracks the stock of unclosed contracts.
- A 10-day moving average of that open-interest ratio was used to mute short-horizon noise and support an intermediate-term reading of option-writer positioning.
- Across a six-year window the 10-day average fell below 0.50 on only three occasions and exceeded 1.90 on only five, and a mechanical overlay treated a turn up from 0.50 or lower as buy-mode and a turn down from 1.90 or higher as sell-mode.
- The case study stated that a signal does not specify the start date or size of any later move, and it presented the ratio as one input to weigh with other technical evidence.
Building the ratio from open interest
A put/call ratio can be built from outstanding index-option open interest instead of from traded volume or dollar premium. In this workflow the put/call ratio is a comparison of put contracts with call contracts, applied to outstanding positions rather than to traded volume or premium dollars.
Open interest is the stock of unclosed option contracts used as a positioning measure instead of a transaction-flow measure.
Smoothing for an intermediate reading
A 10-day moving average of that open-interest ratio was used to mute short-horizon noise and support an intermediate-term reading. The ten-day moving average is a fixed lookback smoother applied to the open-interest put/call series so day-to-day noise does not dominate the reading.
Option-writer positioning
The reading assumed option writers create more calls when they expect lower prices and more puts when they expect higher prices. Option-writer positioning is the inferred stance of sellers who create puts or calls, taken from which side of the market they choose to write.
Rare extremes and the mechanical overlay
A 10-day reading near a 2-to-1 imbalance in either direction was treated as rare and often appeared in option-expiration weeks. Across the six-year window discussed, the 10-day average fell below 0.50 on only three occasions. Across the same window, the 10-day average exceeded 1.90 on only five occasions.
A mechanical overlay treated a turn up from 0.50 or lower as buy-mode and a turn down from 1.90 or higher as sell-mode. That mechanical threshold is a predefined extreme-and-reversal rule that marks buy-mode or sell-mode on the smoothed ratio without stating how far prices may travel.
A dated sell-mode turn
The ratio reached 1.96 in late July 1989 and turned down from above 1.90 on 2 August 1989, which the case study marked as the first sell-mode reading in two years. The case study stated that a signal does not specify the start date or size of any later move, and that two or three similar extremes can appear as much as six months apart.
Weighing the overlay with other evidence
The ratio was presented as one input to weigh with other technical evidence, not as a standalone decision rule.
Rare 10-day OEX put/call open-interest extremes, 1983–1989
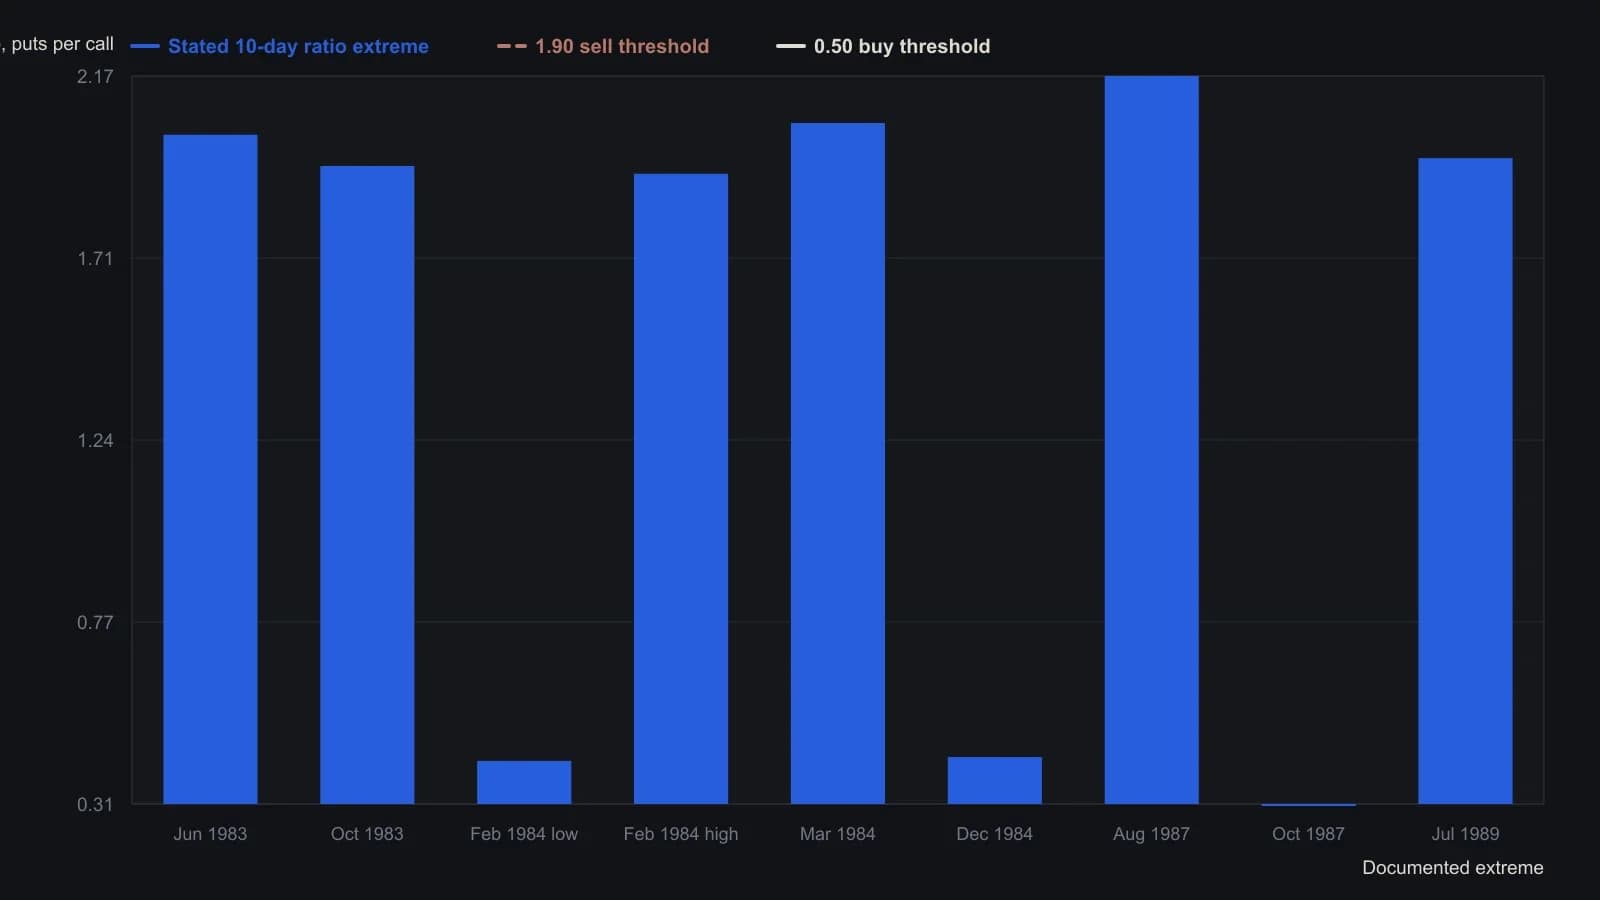
Ratio is outstanding OEX put open interest divided by call open interest, then a 10-day moving average. Buy when that average turns up from 0.50 or less; sell when it turns down from 1.90 or more. February 1984 printed both a 0.42 low and a one-day 1.92 high; the article does not give their order inside the month.
All readings on this track · 31 readings
- 1989Constructing an open-interest-scaled put-call ratio
- 1990Open-interest put/call ratio as an intermediate sentiment overlay
- 1990Activity-weighted call-put ratio for options regime context
- 1990Stacking moving averages, put-call regimes, and double bottoms
- 1991Constructing put-call open-interest regime filters
- 1991Constructing an activity-weighted call-put sentiment reading
- 1991Fund-index regime, put-call confirmation, then the tracking fund
- 1992A seven-vote sentiment score for fund-sleeve regimes
- 1992Construct an activity-weighted call-put ratio before reading crowd conviction
- 1992Pair action with opinion in a composite sentiment index
- 1992Crowd extremes as a three-gate contrary procedure
- 1993Constructing a put-volume average regime filter
- 1993Neural-net inputs and rule trees for mechanical systems
- 1994Failed Treasury put-call signal and a dollar regime shift
- 1994Separate survey, put-call, and premium ledgers before a regime call
- 1994Repeated option-premium prints and a four-zone regime map
- 1995Consecutive-day regimes in the put-call premium ratio
- 1995Construct a put-call ratio for regime-aware contrarian signals
- 1996Treat one options idea as a regime-aware portfolio decision
- 1997Options open interest, put-call sentiment, and contrarian context
- 2000A two-layer put-call construction for intermediate market conditions
- 2002Sentiment confirmation for trend-following options
- 2003Construct a regime overlay from implied volatility and the put-call ratio
- 2004Dollar-weighted Put-call ratio construction
- 2006Debit put spreads inside put-call regimes
- 2011Put-call ratio cycle phases for index context
- 2011Constructing a put-call ratio cycle indicator
- 2011Building a put-call ratio indicator stack
- 2011Put-call ratio regime context with oscillator and band confirmation
- 2018Reading seasonal regimes with put-call divergence and bands
- 2020Treat close-only volume as a hypothesis, then choose regime or phase