1992issue C041-11
Pair action with opinion in a composite sentiment index
Pair what traders say with what they actually buy or sell, then read the weekly blend as a regime filter. Action and opinion often move together, then diverge for about one to two weeks, so the composite is a confidence tie-breaker rather than a mechanical entry clock.
- Action and opinion series often move together but usually diverge unequally, typically by about one to two weeks, so waiting for the lagging half can delay a decision.
- Equal 50/50 weighting was chosen because the action and opinion components showed near-identical volatility in bonds, Eurodollars, gold, and stocks.
- A conventional 20-day call/put volume ratio is noisy day to day, so open interest analysis is added to tell new buying and selling from liquidation.
- Extremes were more useful for a short rubber-band snap than as proof that a cycle high or low was already in, and the composite is a confidence tie-breaker, not a standalone timing signal.
Why a single reading is rarely enough
A single sentiment reading is rarely enough to act on. Action and opinion sentiment series often move together, but they usually diverge unequally and typically by about one to two weeks, so waiting for the lagging half can delay a decision.
The archive workflow answers that gap with a composite sentiment index, an equal-weight blend of an options-activity series and an opinion-survey series. The blend is used to judge whether fear or greed is broad enough to mark a possible turning regime.
How the weekly blend is built
The composite is built weekly from the Friday close of a 20-day options TRIN and a four-week moving average of a Friday opinion survey, then averaged. That Friday-close sample treats weekend positioning as more informative than a midweek bookkeeping print.
The action component is the options-market half of the blend. It is built from call and put volume and open interest so that it reflects money committed rather than stated views. The opinion component is the survey half, a smoothed reading of how many respondents say they are bullish or bearish.
After tests of other weights, equal 50/50 weighting was chosen because the action and opinion components showed near-identical volatility in bonds, Eurodollars, gold, and stocks.
Open interest turns a noisy ratio into an action reading
A conventional 20-day call/put volume ratio is noisy day to day, so open interest is added to tell new buying and selling from liquidation. Open interest analysis uses outstanding option contracts, together with volume, to see whether trading is opening new bets or closing old ones.
In this construction the put-call ratio is a crowd-positioning gauge rather than a price forecast by itself. The call-put TRIN is the volume-to-open-interest form of that ratio, and it distinguishes new speculative flow from liquidation of existing contracts.
The options TRIN uses daily futures call volume over put open interest in one figure and, in the construction note, call volume relative to call open interest divided by put volume relative to put open interest. Summing volume and open-interest ranges before taking ratios weights busy days more than quiet days when a moving average of the TRIN is computed.
A moving average is the lookback smoother applied to noisy daily option ratios or weekly survey readings so Friday snapshots can be compared across weeks.
Extremes often mark a snap, not the cycle turn
On the June 21, 1991 bond close, the call/put TRIN was 0.70 and the survey series about 38. The composite later reached nearly two standard deviations from its five-year mean at the July 5 retest.
Over about four and a half years of the bond study, only three clear-cut buy extremes were identified (1987, 1990, and 1991). The 1989 advance was largely missed while the index and prices stayed in a range.
Extremes were more useful for a short three- to four-point snapback than as proof that the cycle high or low was already in, and some tops arrived weeks after the sentiment peak. That rebound is the rubber-band snap: a short, violent move that may not be the final high or low of the larger trend.
Gold composite sentiment, weekly 1988–1992
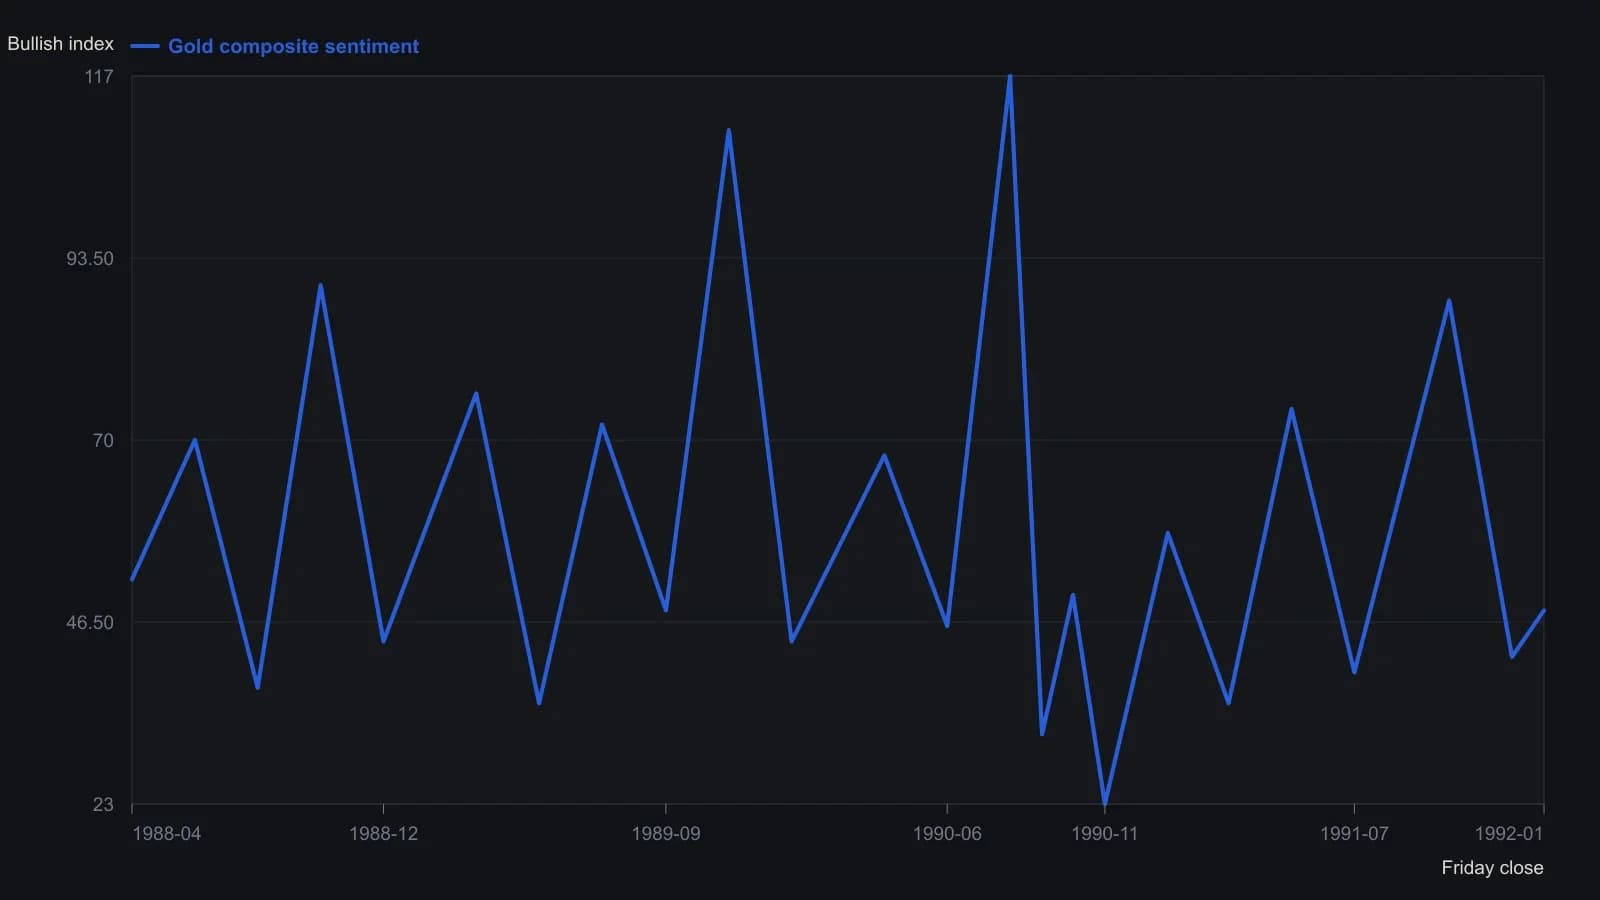
Low-resolution scan: dates to the nearest month and index readings to a few points. Martin fixed a Friday close and a 50/50 blend. The plotted series begins in 1988, after both components exist, not at the February 1987 axis origin.
Use the blend as a tie-breaker
The composite is presented as a confidence tie-breaker to be combined with other methods, not as a standalone mechanical timing signal.
Editorial: once the action component and the opinion component agree that the crowd is stretched, the blend belongs beside other methods as regime context, leaving the entry decision to those other methods.
All readings on this track · 31 readings
- 1989Constructing an open-interest-scaled put-call ratio
- 1990Open-interest put/call ratio as an intermediate sentiment overlay
- 1990Activity-weighted call-put ratio for options regime context
- 1990Stacking moving averages, put-call regimes, and double bottoms
- 1991Constructing put-call open-interest regime filters
- 1991Constructing an activity-weighted call-put sentiment reading
- 1991Fund-index regime, put-call confirmation, then the tracking fund
- 1992A seven-vote sentiment score for fund-sleeve regimes
- 1992Construct an activity-weighted call-put ratio before reading crowd conviction
- 1992Pair action with opinion in a composite sentiment index
- 1992Crowd extremes as a three-gate contrary procedure
- 1993Constructing a put-volume average regime filter
- 1993Neural-net inputs and rule trees for mechanical systems
- 1994Failed Treasury put-call signal and a dollar regime shift
- 1994Separate survey, put-call, and premium ledgers before a regime call
- 1994Repeated option-premium prints and a four-zone regime map
- 1995Consecutive-day regimes in the put-call premium ratio
- 1995Construct a put-call ratio for regime-aware contrarian signals
- 1996Treat one options idea as a regime-aware portfolio decision
- 1997Options open interest, put-call sentiment, and contrarian context
- 2000A two-layer put-call construction for intermediate market conditions
- 2002Sentiment confirmation for trend-following options
- 2003Construct a regime overlay from implied volatility and the put-call ratio
- 2004Dollar-weighted Put-call ratio construction
- 2006Debit put spreads inside put-call regimes
- 2011Put-call ratio cycle phases for index context
- 2011Constructing a put-call ratio cycle indicator
- 2011Building a put-call ratio indicator stack
- 2011Put-call ratio regime context with oscillator and band confirmation
- 2018Reading seasonal regimes with put-call divergence and bands
- 2020Treat close-only volume as a hypothesis, then choose regime or phase