1995issue C101-5
Construct a put-call ratio for regime-aware contrarian signals
A Put-call ratio series is constructed from daily put volume divided by call volume, then smoothed with a Moving average so crowd positioning can be read as market-regime context rather than a single-day print. Index-option and equity-option ratios are built separately, and static combined-volume bands are replaced with local peaks and troughs on that smoothed path, read as a Contrarian strategy.
- Construct the series from daily put volume divided by call volume, then smooth it with a Moving average so crowd positioning is market-regime context rather than a single-day print.
- Build index-option and equity-option ratios separately, because hedging lifts typical index readings near 1.00 while equity call volume is typically about twice put volume and a typical equity reading is near 0.50.
- Replace fixed combined-volume bands with local maxima and minima on the moving-average path: a peak that turns down is treated as a buy point and a trough that turns up as a sell point.
- Treat unusually heavy call buying as crowded optimism and unusually heavy put buying as crowded pessimism, and do not treat index and equity series as interchangeable regime gauges.
Build a smoothed put-call series
A Put-call ratio series is constructed from daily put volume divided by call volume, then smoothed with a Moving average. Crowd positioning can then be read as a market-regime context rather than a single-day print.
The same construction is used as a Contrarian strategy. Unusually heavy call buying is treated as crowded optimism, and unusually heavy put buying is treated as crowded pessimism.
21-day moving average of the equity-only put-call ratio
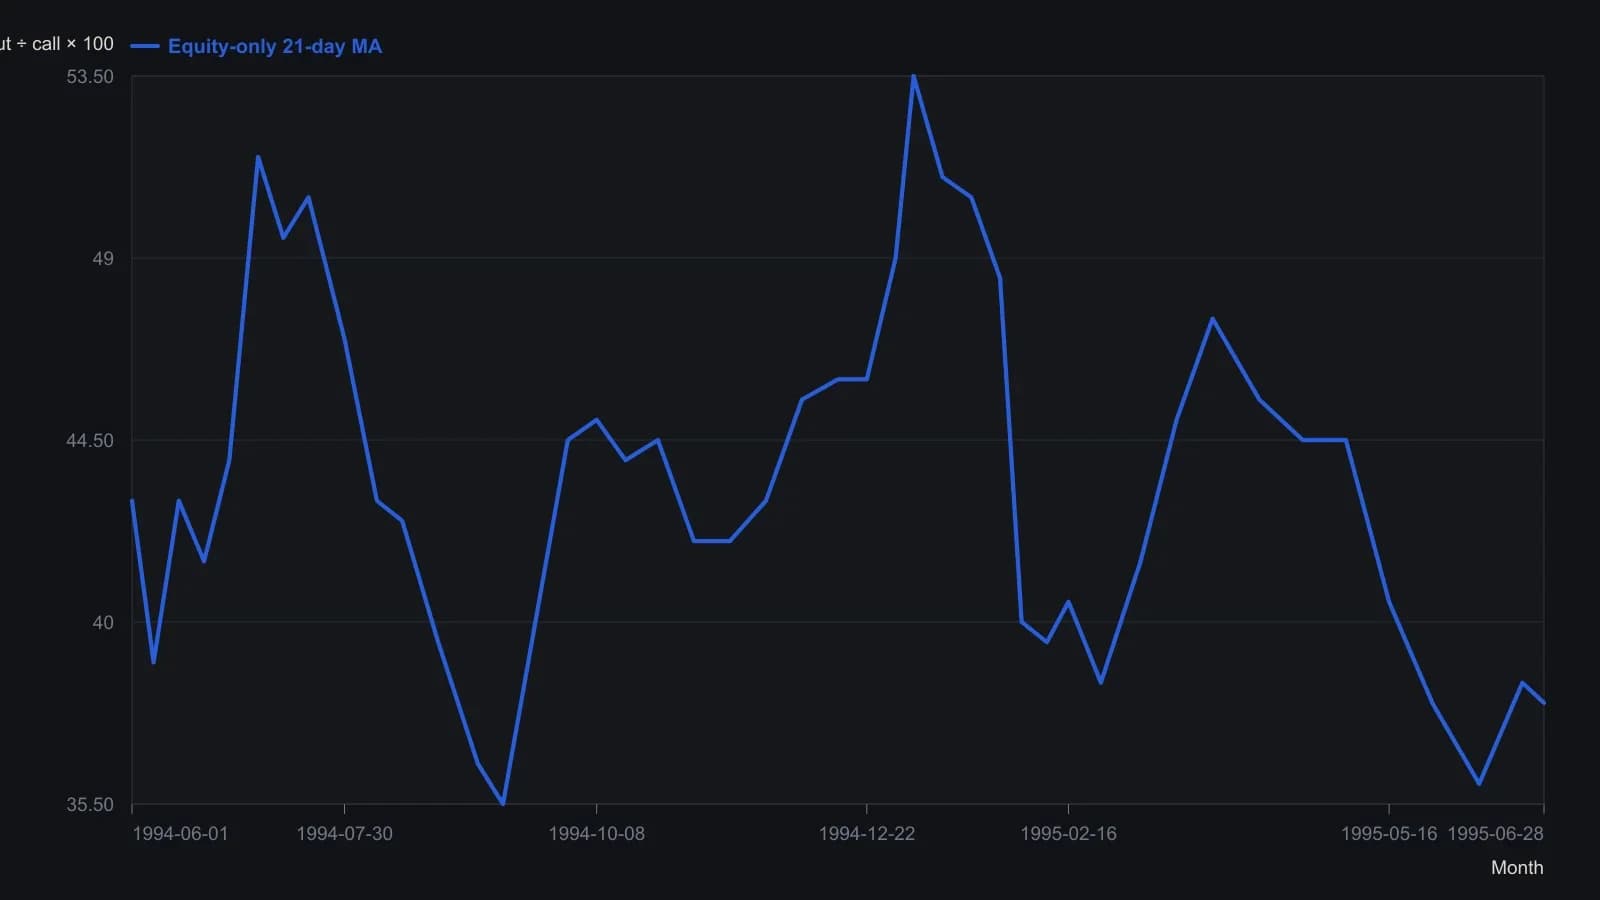
Index and sector volume are stripped out before the ratio is formed. McMillan dropped the old 65/35 percent fixed bands after they failed in 1986-87. Points are read from a magazine raster, so levels are approximate to about half a ratio point.
Split index hedges from equity speculation
Index-option and equity-option ratios must be built separately because hedging routinely lifts index put activity toward a typical daily reading near 1.00, while equity call volume is typically about twice put volume and a typical equity reading is near 0.50.
Equity-only volume is often viewed as a cleaner speculative input, while liquid index options mix speculative flow with institutional hedges against stock holdings. The two series are not interchangeable regime gauges.
Replace fixed extremes with turning points
Fixed combined-volume thresholds lost reliability after mid-1980s index-put hedging distorted the blended exchange totals. Those rules included buying when total puts exceeded 65 percent of total calls, or selling when they fell below 35 to 40 percent.
A preferred construction replaces those static bands with local maxima and minima on the moving-average path. A peak that turns down is treated as a buy point, and a trough that turns up is treated as a sell point.
One illustrated construction uses a 21-day Moving average of the equity-only ratio, with buy marks at peaks that turn down and sell marks at low readings that turn up.
Isolate equity-only volume
Equity-only volume can be approximated by subtracting listed index and related option volume from exchange totals. It can also be computed stock-by-stock from a dedicated database when a cleaner speculative series is required.
Apply the same reading with a purpose-specific limit
The same peak-and-trough reading was applied to a 21-day gold-futures options ratio. June-August 1994 readings near one put per call coincided with a later rebound from about 380 toward above 400, while mid-1995 readings near five calls per put were treated as unfinished bearish context.
The construction is described as less consistent on individual commodity-futures option books than on stock-market series because those option markets are thinner. It is framed as a purpose-specific context tool rather than a universal signal.
All readings on this track · 31 readings
- 1989Constructing an open-interest-scaled put-call ratio
- 1990Open-interest put/call ratio as an intermediate sentiment overlay
- 1990Activity-weighted call-put ratio for options regime context
- 1990Stacking moving averages, put-call regimes, and double bottoms
- 1991Constructing put-call open-interest regime filters
- 1991Constructing an activity-weighted call-put sentiment reading
- 1991Fund-index regime, put-call confirmation, then the tracking fund
- 1992A seven-vote sentiment score for fund-sleeve regimes
- 1992Construct an activity-weighted call-put ratio before reading crowd conviction
- 1992Pair action with opinion in a composite sentiment index
- 1992Crowd extremes as a three-gate contrary procedure
- 1993Constructing a put-volume average regime filter
- 1993Neural-net inputs and rule trees for mechanical systems
- 1994Failed Treasury put-call signal and a dollar regime shift
- 1994Separate survey, put-call, and premium ledgers before a regime call
- 1994Repeated option-premium prints and a four-zone regime map
- 1995Consecutive-day regimes in the put-call premium ratio
- 1995Construct a put-call ratio for regime-aware contrarian signals
- 1996Treat one options idea as a regime-aware portfolio decision
- 1997Options open interest, put-call sentiment, and contrarian context
- 2000A two-layer put-call construction for intermediate market conditions
- 2002Sentiment confirmation for trend-following options
- 2003Construct a regime overlay from implied volatility and the put-call ratio
- 2004Dollar-weighted Put-call ratio construction
- 2006Debit put spreads inside put-call regimes
- 2011Put-call ratio cycle phases for index context
- 2011Constructing a put-call ratio cycle indicator
- 2011Building a put-call ratio indicator stack
- 2011Put-call ratio regime context with oscillator and band confirmation
- 2018Reading seasonal regimes with put-call divergence and bands
- 2020Treat close-only volume as a hypothesis, then choose regime or phase