1993issue C031-9
Constructing a put-volume average regime filter
A one-sided options-volume overlay compares aggregate put volume with its own 10-day simple moving average. A same-day reading more than twice that average raises a long-bias regime flag, described as arriving more often at a momentum low than at the final price low.
- Contrarian portfolio context first measures the direction of speculative sentiment, then treats a crowded path as the stance to stand apart from.
- A put-call ratio divides put volume by call volume and then smooths the series, while a standalone construction instead uses put-volume-relative: current put volume versus its own 10-day average.
- The long-bias regime flag rises when current put volume is more than twice its 10-day average, and it is described as arriving more often at a momentum low than at the final price low.
- Implementation uses total CBOE put volume, a 10-day simple moving average, and a same-day-threshold so a surge day raises the hurdle. The construction marks important trading lows and is not paired with a call-volume marker for tops.
Sentiment first, then stand apart
Contrarian portfolio context is framed as first measuring the direction of speculative sentiment, then treating a crowded path as the stance to stand apart from.
This note reconstructs a one-sided options-volume overlay from that framing: a testable fear-surge flag built from put activity versus its own moving average.
From put-call balance to self-history
A put-call ratio is built by dividing put volume by call volume and smoothing the series. High readings are read as puts overwhelming calls and low readings as the reverse.
A 10-day smoother is presented as a common put-call implementation. An open-interest-adjusted variant is associated with longer averages such as 60 days and contains no price term.
Comparing call volume only to its own recent averages did not yield a standalone construction, whereas comparing put volume to its own 10-day average did. Put-volume-relative uses that self-history when the relativity of interest is the series against itself rather than puts versus calls.
How the surge flag is assembled
Implementation uses total CBOE put volume, a 10-day simple moving average, and a same-day comparison.
The put-volume construction raises a long-bias regime flag when current put volume is more than twice its 10-day average.
Put volume versus its 10-day average, 1989–90
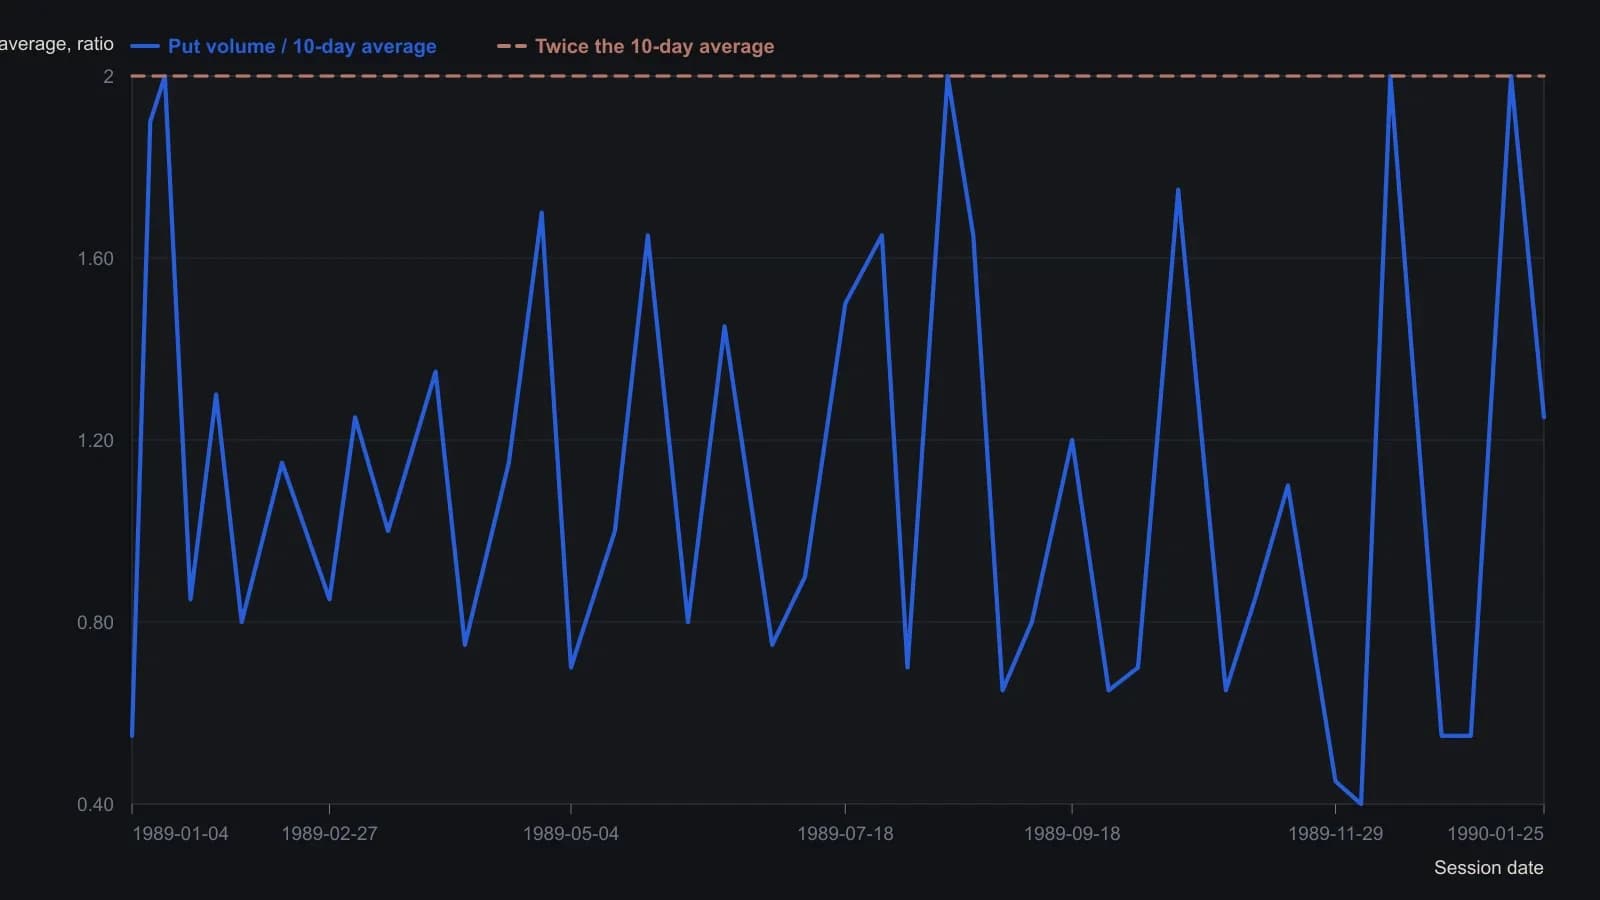
Bollinger’s Formula 3 is total CBOE put volume divided by its 10-day simple moving average; he wrote that no other window improved that result. The raster is a daily oscillator on a 0.5 grid, so readings are approximate to about 0.1 on the ratio and about a week on the calendar.
Where the flag is meant to land
The flag is described as arriving more often at a momentum low than at the final price low. A momentum low is the low in downside thrust that may precede the final price low, and it is the intended location of a put-volume surge flag.
The same construction is presented as a marker of important trading lows and is not paired with an analogous call-volume marker for tops.
Yearly charts covering 1983 through 1992 record uneven trigger counts, including a year with no flags, early and clustered flags, and at least one case treated as requiring a separate check that a momentum low had formed.
All readings on this track · 31 readings
- 1989Constructing an open-interest-scaled put-call ratio
- 1990Open-interest put/call ratio as an intermediate sentiment overlay
- 1990Activity-weighted call-put ratio for options regime context
- 1990Stacking moving averages, put-call regimes, and double bottoms
- 1991Constructing put-call open-interest regime filters
- 1991Constructing an activity-weighted call-put sentiment reading
- 1991Fund-index regime, put-call confirmation, then the tracking fund
- 1992A seven-vote sentiment score for fund-sleeve regimes
- 1992Construct an activity-weighted call-put ratio before reading crowd conviction
- 1992Pair action with opinion in a composite sentiment index
- 1992Crowd extremes as a three-gate contrary procedure
- 1993Constructing a put-volume average regime filter
- 1993Neural-net inputs and rule trees for mechanical systems
- 1994Failed Treasury put-call signal and a dollar regime shift
- 1994Separate survey, put-call, and premium ledgers before a regime call
- 1994Repeated option-premium prints and a four-zone regime map
- 1995Consecutive-day regimes in the put-call premium ratio
- 1995Construct a put-call ratio for regime-aware contrarian signals
- 1996Treat one options idea as a regime-aware portfolio decision
- 1997Options open interest, put-call sentiment, and contrarian context
- 2000A two-layer put-call construction for intermediate market conditions
- 2002Sentiment confirmation for trend-following options
- 2003Construct a regime overlay from implied volatility and the put-call ratio
- 2004Dollar-weighted Put-call ratio construction
- 2006Debit put spreads inside put-call regimes
- 2011Put-call ratio cycle phases for index context
- 2011Constructing a put-call ratio cycle indicator
- 2011Building a put-call ratio indicator stack
- 2011Put-call ratio regime context with oscillator and band confirmation
- 2018Reading seasonal regimes with put-call divergence and bands
- 2020Treat close-only volume as a hypothesis, then choose regime or phase