2011issue C1040-44
Put-call ratio cycle phases for index context
The daily put-call ratio is built from individual equity option volume, not from the index's own option series, so it can sit beside a book as an independent-flow input. This installment defines that input and maps repeating price-cycle phases, leaving the transformed indicator to the next part of the series.
- Construct the daily put-call ratio from the equity-options universe and exclude the index's own put-call series, which is not treated as a meaningful input here.
- A reading of 1 is equal put and call volume; the observed series rarely sits above 1 or below 0.45, so it mostly lives between equal flow and about 2.5 times more calls than puts.
- Do not treat a raw linear plot as the indicator: puts can print from 1 to 10 while calls compress from 0.1 to 1, so the series still needs transformation.
- Read the ratio through price-cycle phases, starting with an up-turn warning when the indicator rises as the index declines, so one trade sits in a weeks-to-months context.
A ratio built for context, not a single print
This installment defines the daily put-call ratio and maps its cyclical phases. The finished indicator construction is left to the next part of the series.
Editorial reading: treat one options-flow ratio as a regime map so a single trade sits inside a weeks-to-months context instead of a one-bar signal.
Define the input from the equity-options universe
The daily put-call ratio is constructed by dividing the sum of all put options traded by all call options traded on individual equity option contracts. That set is the equity-options universe. The index's own put-call series is excluded because it is not treated as a meaningful input for this construction.
A reading of 1 means equal put and call volume. In the observed equity-option history the ratio rarely sits above 1 or below 0.45, so it mostly lives between equal puts and calls and about 2.5 times more calls than puts.
Why a raw linear plot is not the indicator
Puts can print on a linear scale from 1 to 10 while calls compress from 0.1 to 1. A raw linear plot is not treated as a usable construction. The raw series against the index is presented as needing further transformation before it can serve as an indicator.
Raw CBOE equity put/call ratio
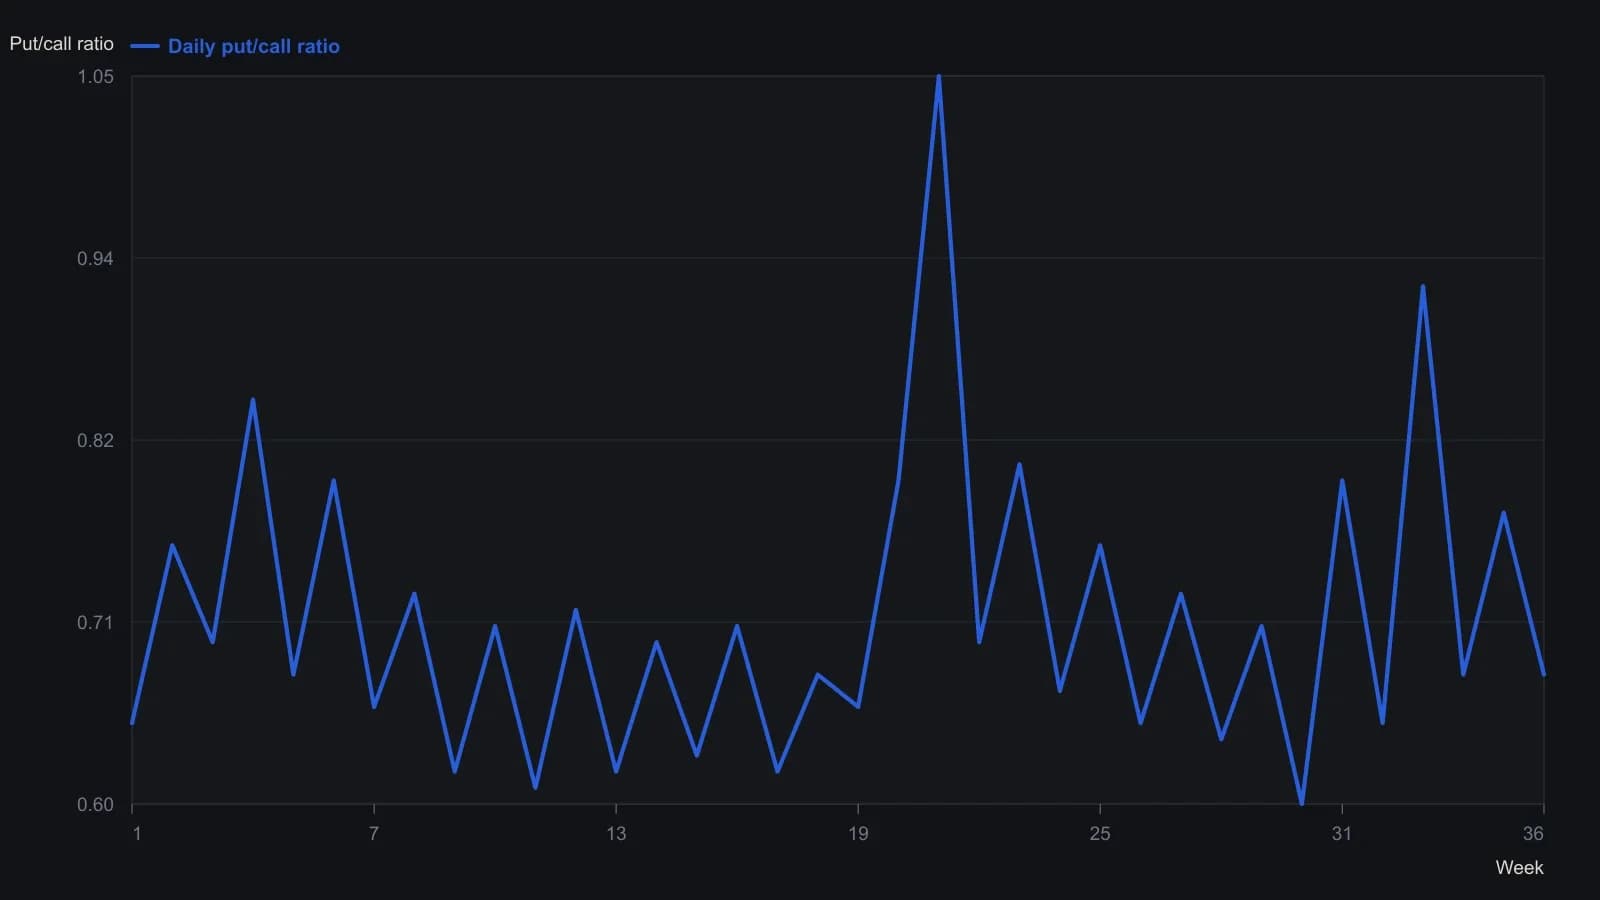
The source builds this from all individual CBOE equity option volume, not from the index’s own option series, and notes that prints rarely leave the 0.45–1.0 band, so a linear scale is a poor fit. Values are approximate to about 0.03.
Keep the series off index price and volume
The ratio is used as an independent-flow input for the next index move because it is not built from the usual price or volume series of the index itself. That construction choice keeps the reading off the index so it can sit beside a diversified or regime-aware book.
The usual co-movement in this construction is inverse. The index tends to rise while the ratio falls, which means more calls than puts, and to fall while the ratio rises, which means more puts than calls.
Walk the same market through price-cycle phases
In a normal short-term down move the first cycle phase is an up-turn warning: the put-call-ratio indicator is moving up while the index is declining. That phase is treated as an early regime warning rather than a completed reversal.
Later phases of the same cycle are described as a sequence of stock, call, and put opening and closing actions by private and professional participants. The completed loop returns to the first phase after a medium-term downward price move. These price-cycle phases classify positioning. They are not a timer for a single print.
All readings on this track · 31 readings
- 1989Constructing an open-interest-scaled put-call ratio
- 1990Open-interest put/call ratio as an intermediate sentiment overlay
- 1990Activity-weighted call-put ratio for options regime context
- 1990Stacking moving averages, put-call regimes, and double bottoms
- 1991Constructing put-call open-interest regime filters
- 1991Constructing an activity-weighted call-put sentiment reading
- 1991Fund-index regime, put-call confirmation, then the tracking fund
- 1992A seven-vote sentiment score for fund-sleeve regimes
- 1992Construct an activity-weighted call-put ratio before reading crowd conviction
- 1992Pair action with opinion in a composite sentiment index
- 1992Crowd extremes as a three-gate contrary procedure
- 1993Constructing a put-volume average regime filter
- 1993Neural-net inputs and rule trees for mechanical systems
- 1994Failed Treasury put-call signal and a dollar regime shift
- 1994Separate survey, put-call, and premium ledgers before a regime call
- 1994Repeated option-premium prints and a four-zone regime map
- 1995Consecutive-day regimes in the put-call premium ratio
- 1995Construct a put-call ratio for regime-aware contrarian signals
- 1996Treat one options idea as a regime-aware portfolio decision
- 1997Options open interest, put-call sentiment, and contrarian context
- 2000A two-layer put-call construction for intermediate market conditions
- 2002Sentiment confirmation for trend-following options
- 2003Construct a regime overlay from implied volatility and the put-call ratio
- 2004Dollar-weighted Put-call ratio construction
- 2006Debit put spreads inside put-call regimes
- 2011Put-call ratio cycle phases for index context
- 2011Constructing a put-call ratio cycle indicator
- 2011Building a put-call ratio indicator stack
- 2011Put-call ratio regime context with oscillator and band confirmation
- 2018Reading seasonal regimes with put-call divergence and bands
- 2020Treat close-only volume as a hypothesis, then choose regime or phase