1991issue C021-9
Constructing put-call open-interest regime filters
The archive rebuilt a conventional call-over-put volume average by pairing each side with open interest, then asked surveys or a related market to agree. TradersWeek editorial reading: a post-break refusal of bullishness to wash out is a regime label, not a same-session trigger.
- Rebuild the put-call-ratio so each side’s volume is tested against open interest; the resulting call-put-trin can separate new initiation from liquidation.
- Sum each series first, then take the ratios, so high-activity sessions weigh more than quiet ones inside the multi-session window.
- Treat option-ratio extremes as more useful when independent surveys or a related market agree, not as standalone pinpoint timers.
- When bullish surveys hold or rise after a price break, label latent-demand as a regime rather than taking a same-session fade.
Treat crowded options flow as a construction problem
A conventional options-activity gauge is call volume divided by put volume. It is usually smoothed over about 10 sessions because single-session readings swing sharply. In the archive workflow that multi-session average was a put-call-ratio used to label crowded options-flow regimes rather than to time a single bar.
Test volume against open interest
Pairing each side’s volume with its open interest produces a call-put-trin: call volume relative to call open interest, divided by put volume relative to put open interest. Open-interest-analysis uses outstanding call and put contracts to test whether volume is new positioning or liquidation of existing contracts. A 10-session version of that TRIN therefore contains both volume and open interest, unlike a volume-only call/put average.
When the window is computed by summing each series first and then taking the ratios, high-activity sessions receive more weight than quiet ones.
Ask a second reading to agree
Option-ratio extremes were treated as more useful when they coincided with independent survey extremes. They were not presented as standalone pinpoint timers. A contrarian-strategy in this workflow fades a consensus only after options flow, surveys, and a related market agree that uncommitted demand or supply looks exhausted. Cross-market-confirmation checks whether another point on the same curve or a related market prints an extreme the first market did not.
After late-1989 equity weakness, bond futures held a roughly 1.5-point range into late December while bullish survey readings stayed in the mid-50s to low 60s following a mid-November 10-day TRIN near 1.40. When bond TRIN and surveys in November-December 1989 fell short of an ideal sell extreme, short-rate contracts still printed bullish extremes, adding a curve-based context layer.
An equity-index 10-day TRIN peak in August 1989 lined up with a peak in the advance/decline line, but later tops and lows did not print equally aggressive TRIN extremes.
Label a refused washout as a regime
Sentiment-capitulation is a survey or flow washout in which bullish readings collapse after a price break instead of holding or rising. After a near-vertical nine-point January decline, a 10-day TRIN of 0.56 on 7 February 1990 did not bring that washout: bullish readings stayed near 55% and rose to 60% in the next two-week pause. That held bid is latent-demand, uncommitted buying still able to absorb supply after a rally or a pause.
A later TRIN trough near 0.58, including a one-day 0.46 on 2 May 1990 at a June-bond print of 88.10, arrived with about 41% bullish sentiment. Within three weeks survey bullishness was back near 70%.
In gold, a 10-day TRIN near 1.54 after a strong advance, then 1.50 in late January, coincided with a four-week sentiment average near 80%. Gold TRIN turns were described as shorter-horizon than those in bonds or stocks, and a later May 10-day TRIN printed 0.35.
June Treasury bond futures, late 1989–mid 1990
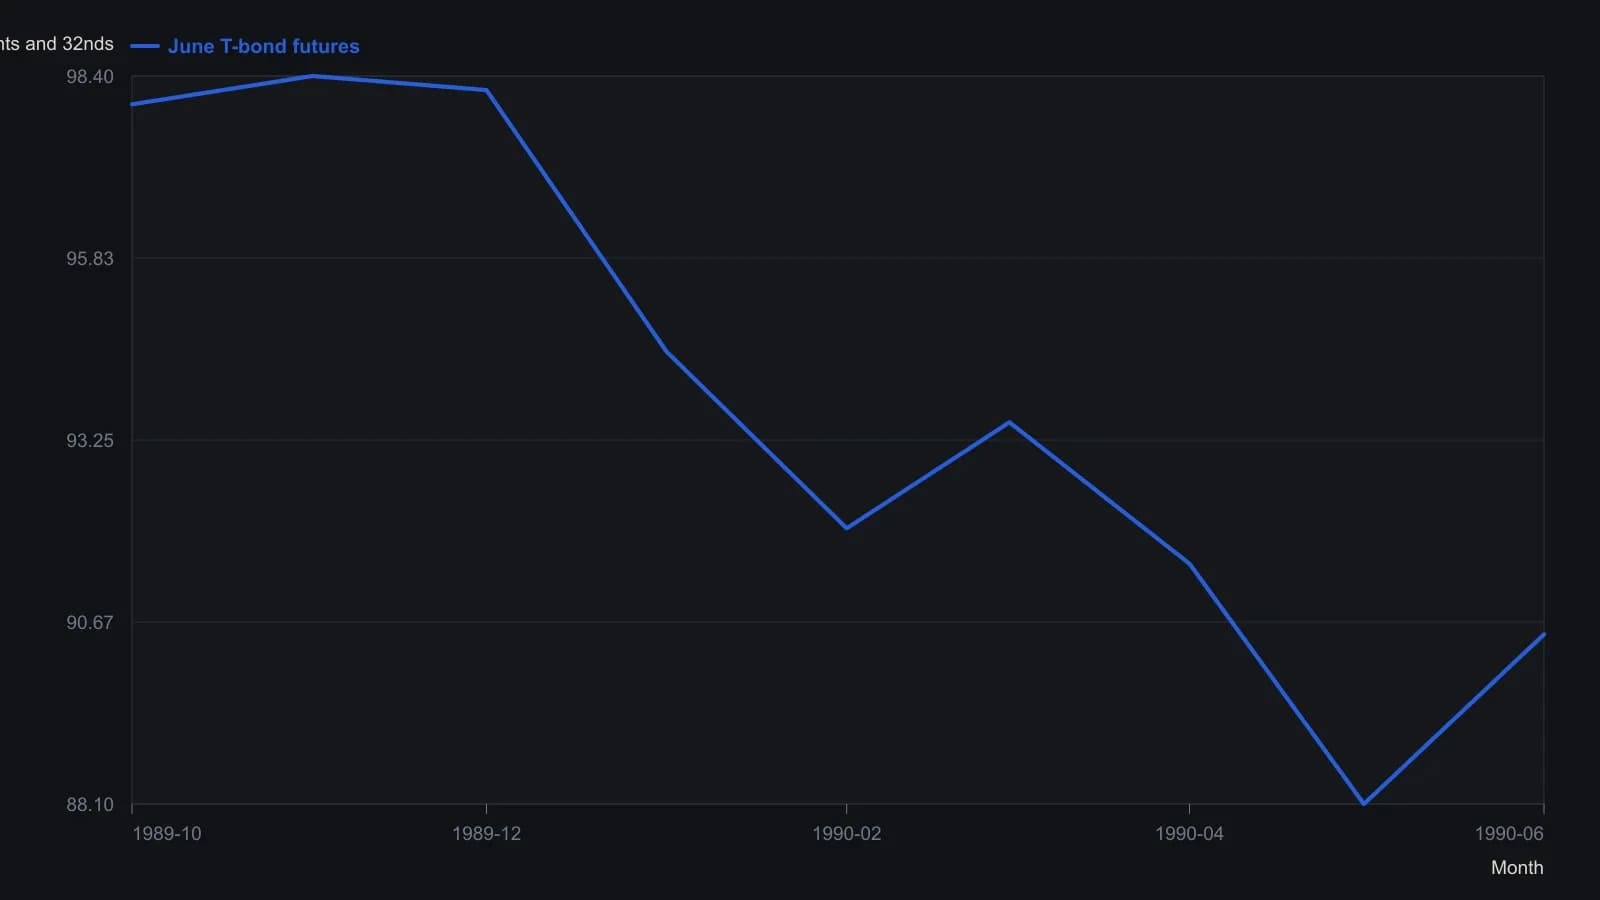
Raster is inverted and coarse; dates and prices are approximate. The May 2, 1990 low of 88.10 is the one printed price the article states exactly.
All readings on this track · 31 readings
- 1989Constructing an open-interest-scaled put-call ratio
- 1990Open-interest put/call ratio as an intermediate sentiment overlay
- 1990Activity-weighted call-put ratio for options regime context
- 1990Stacking moving averages, put-call regimes, and double bottoms
- 1991Constructing put-call open-interest regime filters
- 1991Constructing an activity-weighted call-put sentiment reading
- 1991Fund-index regime, put-call confirmation, then the tracking fund
- 1992A seven-vote sentiment score for fund-sleeve regimes
- 1992Construct an activity-weighted call-put ratio before reading crowd conviction
- 1992Pair action with opinion in a composite sentiment index
- 1992Crowd extremes as a three-gate contrary procedure
- 1993Constructing a put-volume average regime filter
- 1993Neural-net inputs and rule trees for mechanical systems
- 1994Failed Treasury put-call signal and a dollar regime shift
- 1994Separate survey, put-call, and premium ledgers before a regime call
- 1994Repeated option-premium prints and a four-zone regime map
- 1995Consecutive-day regimes in the put-call premium ratio
- 1995Construct a put-call ratio for regime-aware contrarian signals
- 1996Treat one options idea as a regime-aware portfolio decision
- 1997Options open interest, put-call sentiment, and contrarian context
- 2000A two-layer put-call construction for intermediate market conditions
- 2002Sentiment confirmation for trend-following options
- 2003Construct a regime overlay from implied volatility and the put-call ratio
- 2004Dollar-weighted Put-call ratio construction
- 2006Debit put spreads inside put-call regimes
- 2011Put-call ratio cycle phases for index context
- 2011Constructing a put-call ratio cycle indicator
- 2011Building a put-call ratio indicator stack
- 2011Put-call ratio regime context with oscillator and band confirmation
- 2018Reading seasonal regimes with put-call divergence and bands
- 2020Treat close-only volume as a hypothesis, then choose regime or phase