1994issue C071-10
Separate survey, put-call, and premium ledgers before a regime call
The historical workflow kept opinion surveys, multi-day equity put-call streaks, and the dollar-weighted option premium ratio on separate ledgers. Editorial view: a single crowded-options print is not a complete market-regime call.
- Opinion surveys, filtered equity put-call volume, and the option premium ratio were kept as three ledgers, not one blended sentiment score.
- Very high or very low survey bullishness was read as spent or unused cash, but a one- to two-week surge in bullishness was associated with advances rather than a purely contrarian fade.
- Multi-day put-call streaks tracked public-demand persistence, while one-session option premium ratio bands marked dollar-weighted advance, pullback, and exhaustion setups.
- Prints of the option premium ratio below 0.29 were associated only with bear-market arrival or departure, and prints above 1.18 only with explosive bull advances, each noted on the first such reading after more than three months.
Three ledgers, not one print
The historical workflow did not fold every crowded options reading into a single market-regime call. It kept three ledgers: advisor and public opinion surveys, multi-day equity put-call volume streaks, and the dollar-weighted option premium ratio.
The option premium ratio is aggregate listed-equity put premiums divided by aggregate listed-equity call premiums, read as a market-wide sentiment and regime measure. The put-call ratio is equity put volume divided by equity call volume, treated as a sample of public directional demand rather than professional hedging.
Opinion surveys and contrarian positioning
Advisor and public sentiment surveys were applied as a contrarian input. Very high bullishness was read as already-committed capital. Very low bullishness was read as unused cash that can later enter the market.
That reading is contrarian positioning: a crowded bullish or bearish opinion is treated as evidence that incremental buying or selling power has already been spent. Survey readings were not treated as purely contrarian. A one- to two-week surge in bullishness was associated with advances rather than declines.
Filtered put-call volume streaks
Equity put-call volume was treated as a public-demand sample because option sellers were described as hedgers rather than directional speculators. Heavy call activity relative to puts was read as spent buying power. Heavy put activity was read as withheld cash.
Buyout-related and ex-dividend equity options were removed from the put-call tally because those trades were not taken as market-outlook expressions. The remaining series is filtered equity options: a put-call tally that drops those names so the remaining volume better reflects an overall market view.
Four straight sessions of very low equity put-call ratios were described as preceding industrial-average declines. Six or seven straight very high ratios were described as preceding advances. Eight-session runs at or above 0.63 were described as clustering around the 1982, 1990, and 1991 regime turns.
After an advance lasting at least one week, a one-day put-call surge on a flat or down session was treated as a cue that the advance may speed up. During a decline lasting at least one week, a sharp put-call drop on a flat or up session was treated as a cue that the decline may steepen.
Option premium ratio bands
Recorded option premium ratio values spanned 0.03 to 1.74, with a median in the low-to-mid 0.60s. Prints below 0.29 were associated only with the arrival or departure of bear markets. Prints above 1.18 were associated only with explosive bull advances. Each extreme was noted on the first such reading after more than three months.
When the prior month had no readings in the 0.20s, the first two daily prints in the 0.30s occurring within one week were treated as a significant-advance setup.
A one-day drop of more than 0.10 into the 0.49 to 0.51 band was treated as an advance setup. That pattern is the premium plunge band. The 1.02 to 1.04 zone was treated as a decline or pullback area. A one-day rise of more than 0.19 into 0.96 to 1.12 was treated as an exhaustion-style decline setup. That pattern is the premium exhaustion jump.
DJIA advances after premium-ratio drops into 0.49–0.51
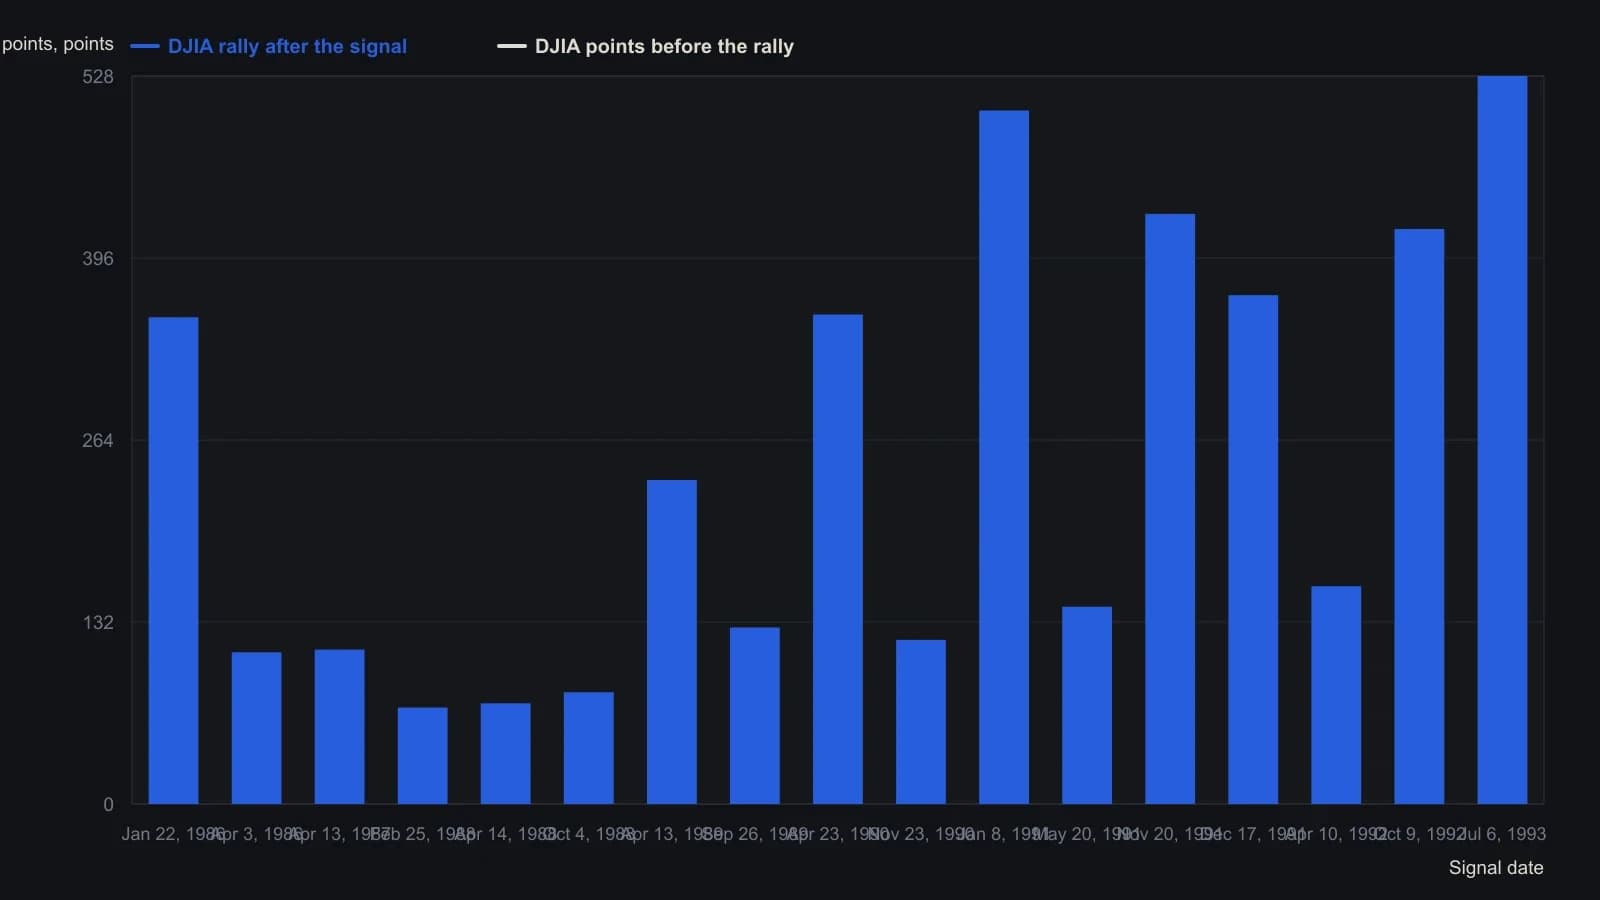
The November 20, 1991 row is footnoted as 13 days plus a small move to the broad-market low. Rally length in the source mixes days and weeks, so only point totals are plotted.
Editorial habit for regime calls
Editorial interpretation: use the survey ledger for committed versus unused cash, the filtered put-call ledger for multi-day public-demand streaks and continuation cues, and the option premium ratio for dollar-weighted regime extremes and one-session bands. The archive described those rules as a historical workflow. It did not treat one crowded print as a substitute for the other two.
All readings on this track · 31 readings
- 1989Constructing an open-interest-scaled put-call ratio
- 1990Open-interest put/call ratio as an intermediate sentiment overlay
- 1990Activity-weighted call-put ratio for options regime context
- 1990Stacking moving averages, put-call regimes, and double bottoms
- 1991Constructing put-call open-interest regime filters
- 1991Constructing an activity-weighted call-put sentiment reading
- 1991Fund-index regime, put-call confirmation, then the tracking fund
- 1992A seven-vote sentiment score for fund-sleeve regimes
- 1992Construct an activity-weighted call-put ratio before reading crowd conviction
- 1992Pair action with opinion in a composite sentiment index
- 1992Crowd extremes as a three-gate contrary procedure
- 1993Constructing a put-volume average regime filter
- 1993Neural-net inputs and rule trees for mechanical systems
- 1994Failed Treasury put-call signal and a dollar regime shift
- 1994Separate survey, put-call, and premium ledgers before a regime call
- 1994Repeated option-premium prints and a four-zone regime map
- 1995Consecutive-day regimes in the put-call premium ratio
- 1995Construct a put-call ratio for regime-aware contrarian signals
- 1996Treat one options idea as a regime-aware portfolio decision
- 1997Options open interest, put-call sentiment, and contrarian context
- 2000A two-layer put-call construction for intermediate market conditions
- 2002Sentiment confirmation for trend-following options
- 2003Construct a regime overlay from implied volatility and the put-call ratio
- 2004Dollar-weighted Put-call ratio construction
- 2006Debit put spreads inside put-call regimes
- 2011Put-call ratio cycle phases for index context
- 2011Constructing a put-call ratio cycle indicator
- 2011Building a put-call ratio indicator stack
- 2011Put-call ratio regime context with oscillator and band confirmation
- 2018Reading seasonal regimes with put-call divergence and bands
- 2020Treat close-only volume as a hypothesis, then choose regime or phase