1995issue C011-14
Consecutive-day regimes in the put-call premium ratio
A listed-equity option-premium-ratio can tag whether a short streak starts cheap or rich before any rule is applied. Consecutive-day-momentum is then a later input for following, fading, or standing aside, not a stand-alone clock.
- The option-premium-ratio compares listed-equity put price premiums with listed-equity call price premiums and is read as a put-call-ratio regime marker, not as a stand-alone entry clock.
- The same consecutive-day-momentum length was associated with later industrial-average advances when it began in a cheap band, and with later declines when it began or ended rich.
- Industrial-average advance and decline streaks were also judged by where the ratio sat at the start or end of the run, so one index idea sits inside option-premium-analysis rather than on price alone.
- A contrarian-strategy follows cheap-band streaks, fades stretched rich combinations, and stands aside when the streak length or premium-regime is incomplete.
A regime tag before a rule
The option-premium-ratio is the daily ratio of listed-equity put price premiums to listed-equity call price premiums. In the archive workflow, that put-call-ratio is a sentiment and regime marker rather than a stand-alone entry clock.
Option-premium-analysis reads those listed-option price premiums as a market-regime overlay. It places a single industrial-average idea in a volatility, carry, and portfolio-weight context over weeks to months.
Historical premium-regime bands
In the historical window described from 1986, daily readings spanned about 0.03 to 1.74. Outside bear legs and runaway bull legs they stayed between 0.29 and 1.18, with typical central values in the low-to-mid 0.60s.
A premium-regime is whether a streak begins or ends in a historically low, mid, or high band of that ratio. Those bands are the context for the consecutive-day associations that follow.
Ratio streaks as continuation or fade
Four consecutive higher or unchanged ratio days that began between 0.32 and 0.51, and five such days that began between 0.32 and 0.52, were associated with subsequent large industrial-average advances.
Five consecutive higher or unchanged ratio days that began above 0.55 were treated as an overbought regime associated with later industrial-average declines.
Three consecutive lower ratio days that ended above 0.82 were associated with later industrial-average declines. Five consecutive lower or unchanged days were associated with later advances regardless of the ratio's level.
Dow follow-through after five-day cheap-start premium-ratio streaks
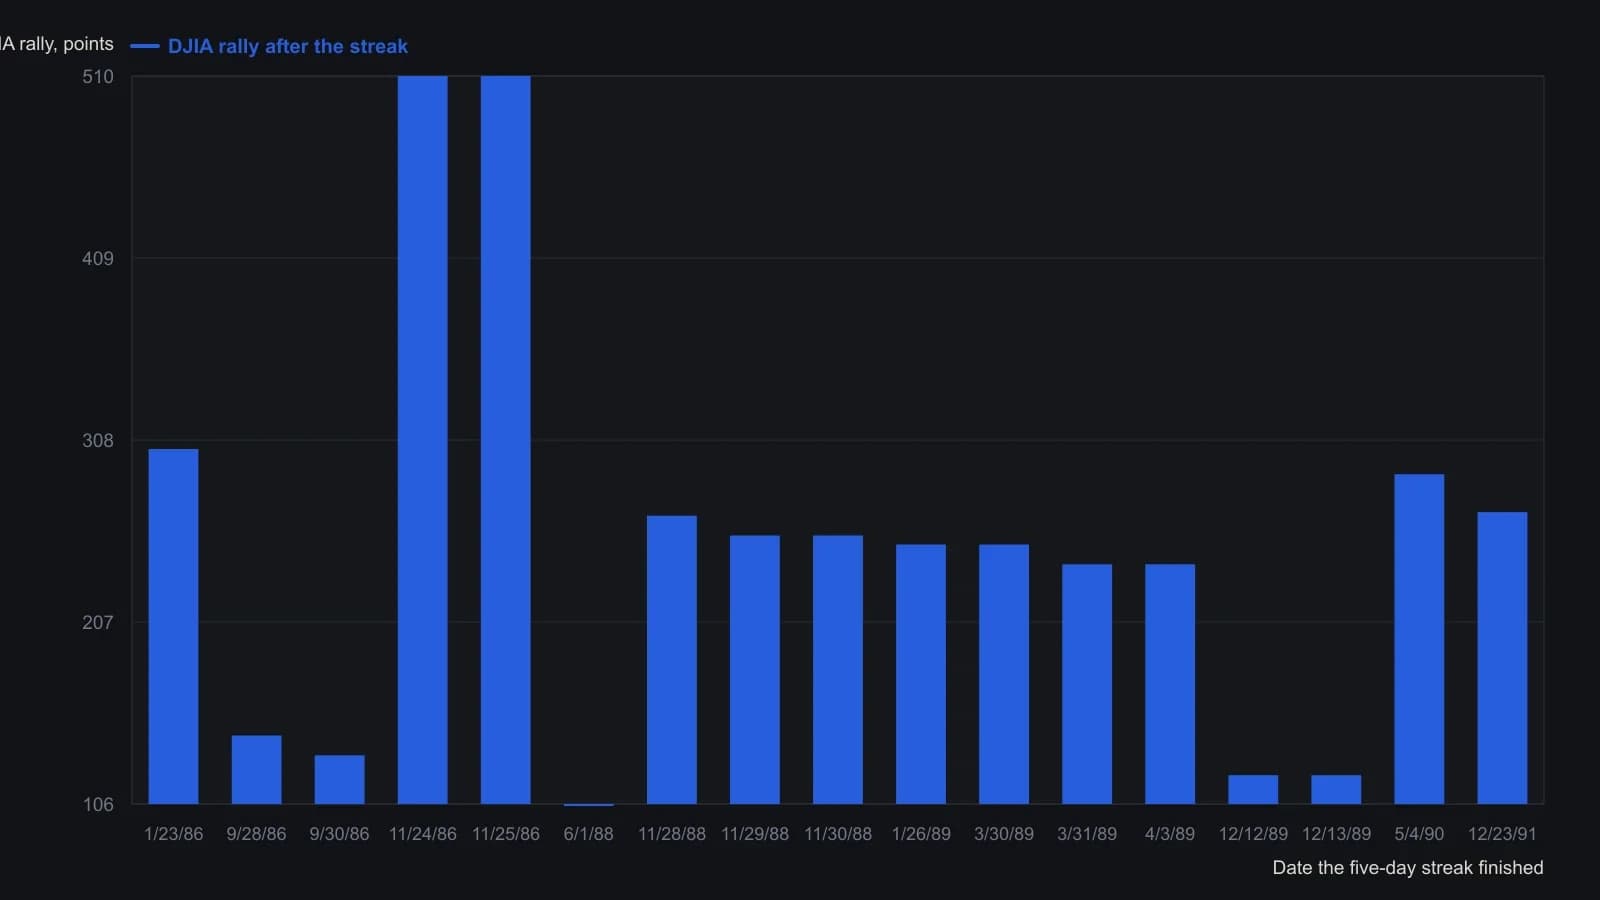
Cadbury treated unchanged prints as part of the five-day up streak and required the first print to sit in the 0.32–0.52 band rather than at crash lows under 0.29. Overlapping finishes that share one later high are left as separate rows, matching the table.
Index streaks read against the ratio
Three consecutive industrial-average advances ending with the ratio near 0.47 to 0.50, stronger three-day advances ending between 0.47 and 0.87, and five-day industrial-average advance streaks ending between 0.42 and 0.84 were associated with further index advances.
Three consecutive large industrial-average advances that ended with the ratio above 1.06 were treated as an overbought fade associated with later declines.
Three consecutive industrial-average losses of more than eight points that began with the ratio above 0.76 were associated with later declines after at least a one-session delay. Four consecutive industrial-average down days ending between 0.34 and 0.45, and five consecutive down days ending between 0.32 and 0.65, were associated with subsequent industrial-average advances.
Follow, fade, or stand aside
A contrarian-strategy is a testable procedure that fades stretched premium-ratio and price-streak combinations, follows the same streak when it begins in a cheap band, and stands aside when the setup is incomplete.
Editorial note: incomplete means the streak length or the starting or ending premium-regime does not match one of the historical associations above. A single industrial-average idea is judged against that option-premium context rather than treated as a stand-alone momentum clock.
All readings on this track · 31 readings
- 1989Constructing an open-interest-scaled put-call ratio
- 1990Open-interest put/call ratio as an intermediate sentiment overlay
- 1990Activity-weighted call-put ratio for options regime context
- 1990Stacking moving averages, put-call regimes, and double bottoms
- 1991Constructing put-call open-interest regime filters
- 1991Constructing an activity-weighted call-put sentiment reading
- 1991Fund-index regime, put-call confirmation, then the tracking fund
- 1992A seven-vote sentiment score for fund-sleeve regimes
- 1992Construct an activity-weighted call-put ratio before reading crowd conviction
- 1992Pair action with opinion in a composite sentiment index
- 1992Crowd extremes as a three-gate contrary procedure
- 1993Constructing a put-volume average regime filter
- 1993Neural-net inputs and rule trees for mechanical systems
- 1994Failed Treasury put-call signal and a dollar regime shift
- 1994Separate survey, put-call, and premium ledgers before a regime call
- 1994Repeated option-premium prints and a four-zone regime map
- 1995Consecutive-day regimes in the put-call premium ratio
- 1995Construct a put-call ratio for regime-aware contrarian signals
- 1996Treat one options idea as a regime-aware portfolio decision
- 1997Options open interest, put-call sentiment, and contrarian context
- 2000A two-layer put-call construction for intermediate market conditions
- 2002Sentiment confirmation for trend-following options
- 2003Construct a regime overlay from implied volatility and the put-call ratio
- 2004Dollar-weighted Put-call ratio construction
- 2006Debit put spreads inside put-call regimes
- 2011Put-call ratio cycle phases for index context
- 2011Constructing a put-call ratio cycle indicator
- 2011Building a put-call ratio indicator stack
- 2011Put-call ratio regime context with oscillator and band confirmation
- 2018Reading seasonal regimes with put-call divergence and bands
- 2020Treat close-only volume as a hypothesis, then choose regime or phase