2018issue C0530-33
Reading seasonal regimes with put-call divergence and bands
A price-only tape is an incomplete view of a market that also moves in time, momentum, and sentiment. This archive article teaches an editorial seasonal-window checklist that withholds regime status until a put-call divergence, a dated split, and a Bollinger Band excursion agree.
- Price, time, momentum, and sentiment move together, so a price-only reading is an incomplete view of the same tape.
- A seasonal window is background regime context, not a standalone trigger.
- Put-call ratios are strongest as bullish divergences versus price, not as raw extremes, and a large band break still needs oscillator pairing.
- As an editorial rule, withhold seasonal regime status until those three independent witnesses can be dated and, if needed, invalidated.
A four-layer tape, not a price-only tape
Markets are framed as moving at once in price, time, momentum, and sentiment. A price-only reading is therefore an incomplete view of the same tape.
A four-layer reading treats price structure, time or seasonality, momentum, and sentiment as simultaneous pieces of one market puzzle. The seasonal window belongs in that time layer as background regime context, not as a standalone trigger.
Locate the price layer first
Price-layer support and resistance are located with Fibonacci ratios, moving averages, and trendlines. Among the main ratios, 0.618 and 1.00 are described as usable from a one-minute chart to a multi-decade chart.
Three 0.618 retracements on a 2011-2013 daily equity-index chart are shown approaching calculated targets without exact prints. Each of those approaches coincided with a slow stochastic reading in the 0-15 zone.
Time can fail on the next session
A Fibonacci session count is a time-layer count that projects a turn on a Fibonacci number of trading sessions. It has no grace period: if a turn is expected on trading day 21 and price is still moving against that call on day 22, the forecast is invalid.
A seasonal window is different in role. It is a recurring calendar stretch used as background, such as the February-to-May equity example in the historical workflow. It does not, by itself, name a regime.
S&P 500 0.618 retracement targets versus actual lows
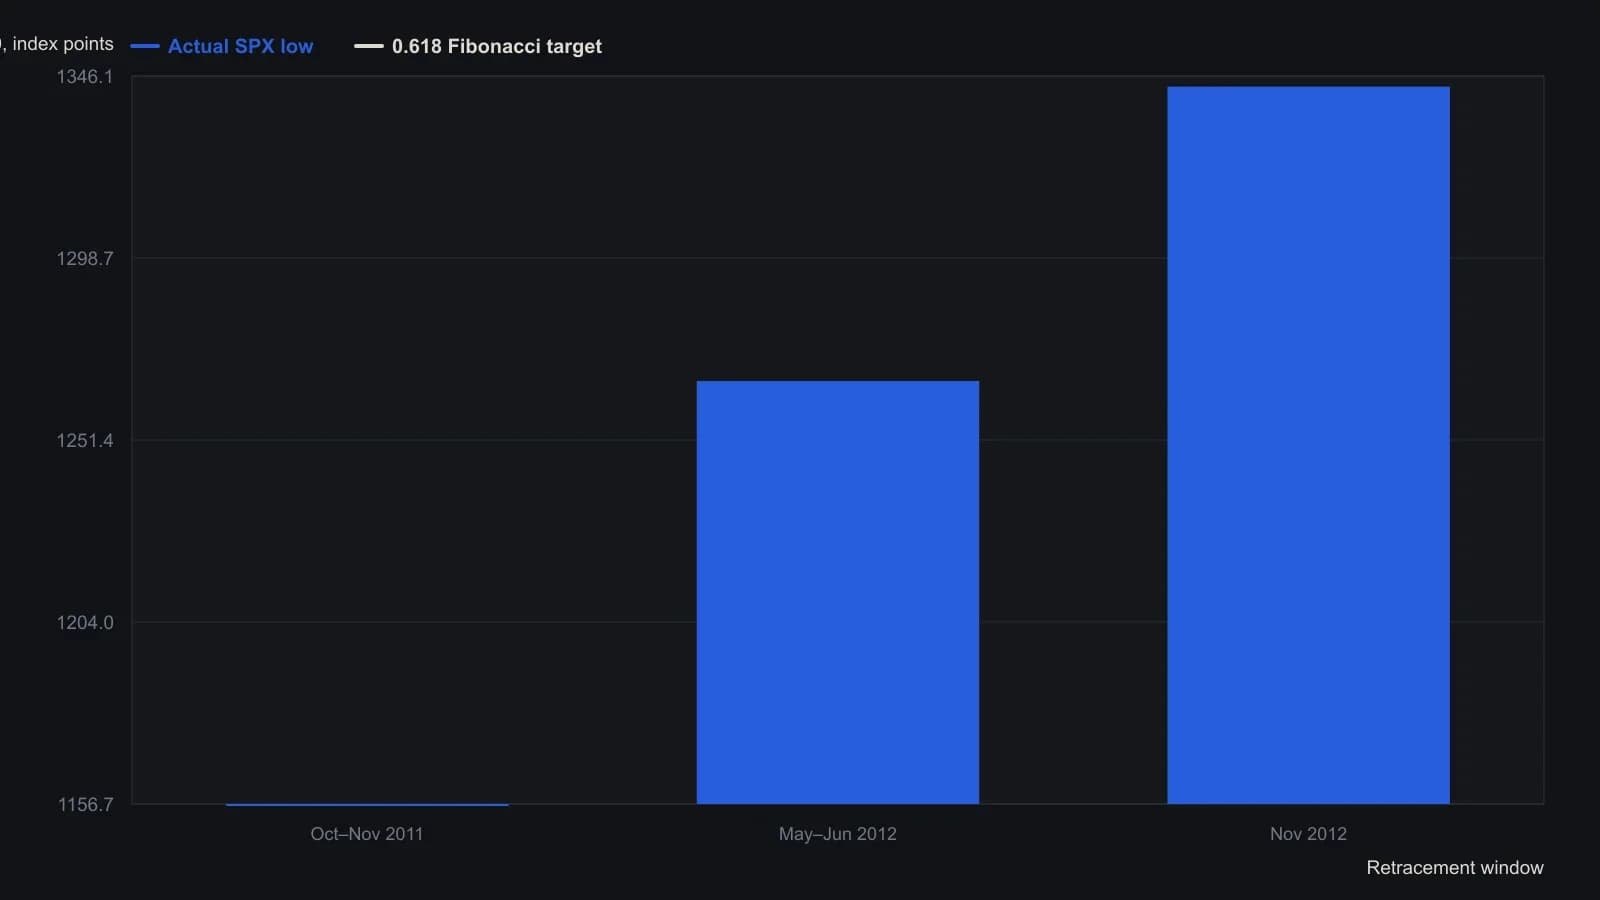
The first target uses the article’s 1,292.66–1,074.77 range multiplied by 0.618. The source said to allow a small leeway above and below any Fibonacci number.
Witness one: put-call divergence
The put-call ratio is an options-volume comparison of puts to calls. It is used here as a weeks-to-months regime layer, especially when the ratio diverges from price rather than merely printing an extreme.
Put/call ratios are a sentiment-layer tool that can mark a turn within a few sessions. The strongest examples are bullish divergences versus price at 2011 and early-2016 equity lows, not raw ratio extremes.
Witness two: a dated split that can fail
Divergence is a dated disagreement between price and an oscillator, a related market, or a sentiment series. That dating turns a repeatable chart condition into a hypothesis that can fail on the next bar or session.
Momentum disagreement is illustrated as oscillator splits versus price, related-market contrasts, and internal breadth such as 52-week new highs and lows. Stochastics are described as typically the earliest oscillator. The MACD histogram and RSI are used for clearer turn signals.
Witness three: a tested volatility envelope
Bollinger Bands are a lookback volatility envelope around a moving average. A large break of the outer band is treated as a quantitative extreme that still needs oscillator confirmation, because it can appear mid-trend.
Large breaks through the upper or lower band are specified as turn evidence only when paired with momentum oscillators. The excursion shows that the envelope has already been tested. It is not a finished turn call on its own.
One rare same-period alignment
A February 2016 equity-index low is used as a rare same-period alignment of bullish oscillator divergences, a double bullish put/call divergence, a February-May seasonal window for U.S. stocks, and a large break below the lower Bollinger Band.
That episode is historical workflow. It shows the four layers arriving together. It is not a present-day market claim, and it does not establish a standalone seasonal trigger.
An editorial checklist, not an archive rule
TradersWeek editorial reading: withhold regime status until the three independent witnesses agree. Date the put-call divergence that maps hedging pressure. Date the price-indicator or intermarket split so it can be invalidated. Confirm that a Bollinger Band excursion has tested the volatility envelope.
If one witness is absent, keep the seasonal window in the background and do not assign regime status. That withholding rule is editorial. It is not attributed to the archive.
All readings on this track · 31 readings
- 1989Constructing an open-interest-scaled put-call ratio
- 1990Open-interest put/call ratio as an intermediate sentiment overlay
- 1990Activity-weighted call-put ratio for options regime context
- 1990Stacking moving averages, put-call regimes, and double bottoms
- 1991Constructing put-call open-interest regime filters
- 1991Constructing an activity-weighted call-put sentiment reading
- 1991Fund-index regime, put-call confirmation, then the tracking fund
- 1992A seven-vote sentiment score for fund-sleeve regimes
- 1992Construct an activity-weighted call-put ratio before reading crowd conviction
- 1992Pair action with opinion in a composite sentiment index
- 1992Crowd extremes as a three-gate contrary procedure
- 1993Constructing a put-volume average regime filter
- 1993Neural-net inputs and rule trees for mechanical systems
- 1994Failed Treasury put-call signal and a dollar regime shift
- 1994Separate survey, put-call, and premium ledgers before a regime call
- 1994Repeated option-premium prints and a four-zone regime map
- 1995Consecutive-day regimes in the put-call premium ratio
- 1995Construct a put-call ratio for regime-aware contrarian signals
- 1996Treat one options idea as a regime-aware portfolio decision
- 1997Options open interest, put-call sentiment, and contrarian context
- 2000A two-layer put-call construction for intermediate market conditions
- 2002Sentiment confirmation for trend-following options
- 2003Construct a regime overlay from implied volatility and the put-call ratio
- 2004Dollar-weighted Put-call ratio construction
- 2006Debit put spreads inside put-call regimes
- 2011Put-call ratio cycle phases for index context
- 2011Constructing a put-call ratio cycle indicator
- 2011Building a put-call ratio indicator stack
- 2011Put-call ratio regime context with oscillator and band confirmation
- 2018Reading seasonal regimes with put-call divergence and bands
- 2020Treat close-only volume as a hypothesis, then choose regime or phase