2007issue C081-3
Expected-equity sizing and geometric drag
A fixed-contract-sizing rule that risks a constant fraction of current equity is first compared with the system's expected-value. The live geometric path sits below that arithmetic mark. Expected equity then replaces current equity, and a monte-carlo-simulation judges the same fraction by the compounded path and the drawdown histogram.
- A fixed-contract-sizing rule that risks a constant fraction of current equity increases size after equity rises and decreases size after equity falls.
- A 40 percent win rate with wins twice as large as losses yields an expected-value of 0.20 per unit risked; a 2 percent equity fraction implies an arithmetic expected change of 0.40 percent of equity per trade.
- With uniform 4 percent wins and 2 percent losses, the live geometric mean is 0.3573 percent per trade. After 100 trades the expected-value path stands at 49.063 percent and the live-equity path stands at 42.813 percent.
- In a 5,000-trade monte-carlo-simulation, expected-equity sizing produced a deeper maximum drawdown of about 50 percent versus about 40 percent for live-equity sizing, with 962 new equity highs versus 641.
Fixed-contract-sizing on current equity
The historical workflow begins with fixed-contract-sizing, a pre-entry exposure rule that converts account equity, a chosen risk fraction, and stop distance into a bounded contract or share count that then scales with the account.
A fixed-contract-sizing rule that risks a constant fraction of current equity increases size after equity rises and decreases size after equity falls.
Expected-value as the arithmetic mark
Expected-value is the average outcome per unit of capital risked, used before entry to translate a system's win rate and payoff ratio into a per-trade expectancy.
A 40 percent win rate with wins twice as large as losses yields an expected-value of 0.20 per unit risked.
Applying a 2 percent equity fraction to that 0.20 expected-value implies an arithmetic expected change of 0.40 percent of equity per trade.
How far the geometric path sits below
The geometric path is the compounded product of successive equity multipliers, whose per-trade average is the geometric mean rather than the arithmetic expected-value.
With uniform 4 percent wins and 2 percent losses, the long-run geometric mean of the live-equity path is 0.3573 percent per trade, below the 0.40 percent arithmetic expected-value.
After 100 trades in the supplied comparison, the expected-value path stands at 49.063 percent while the live-equity fixed-fraction path stands at 42.813 percent.
Fixed-fractional geometric path versus expected equity
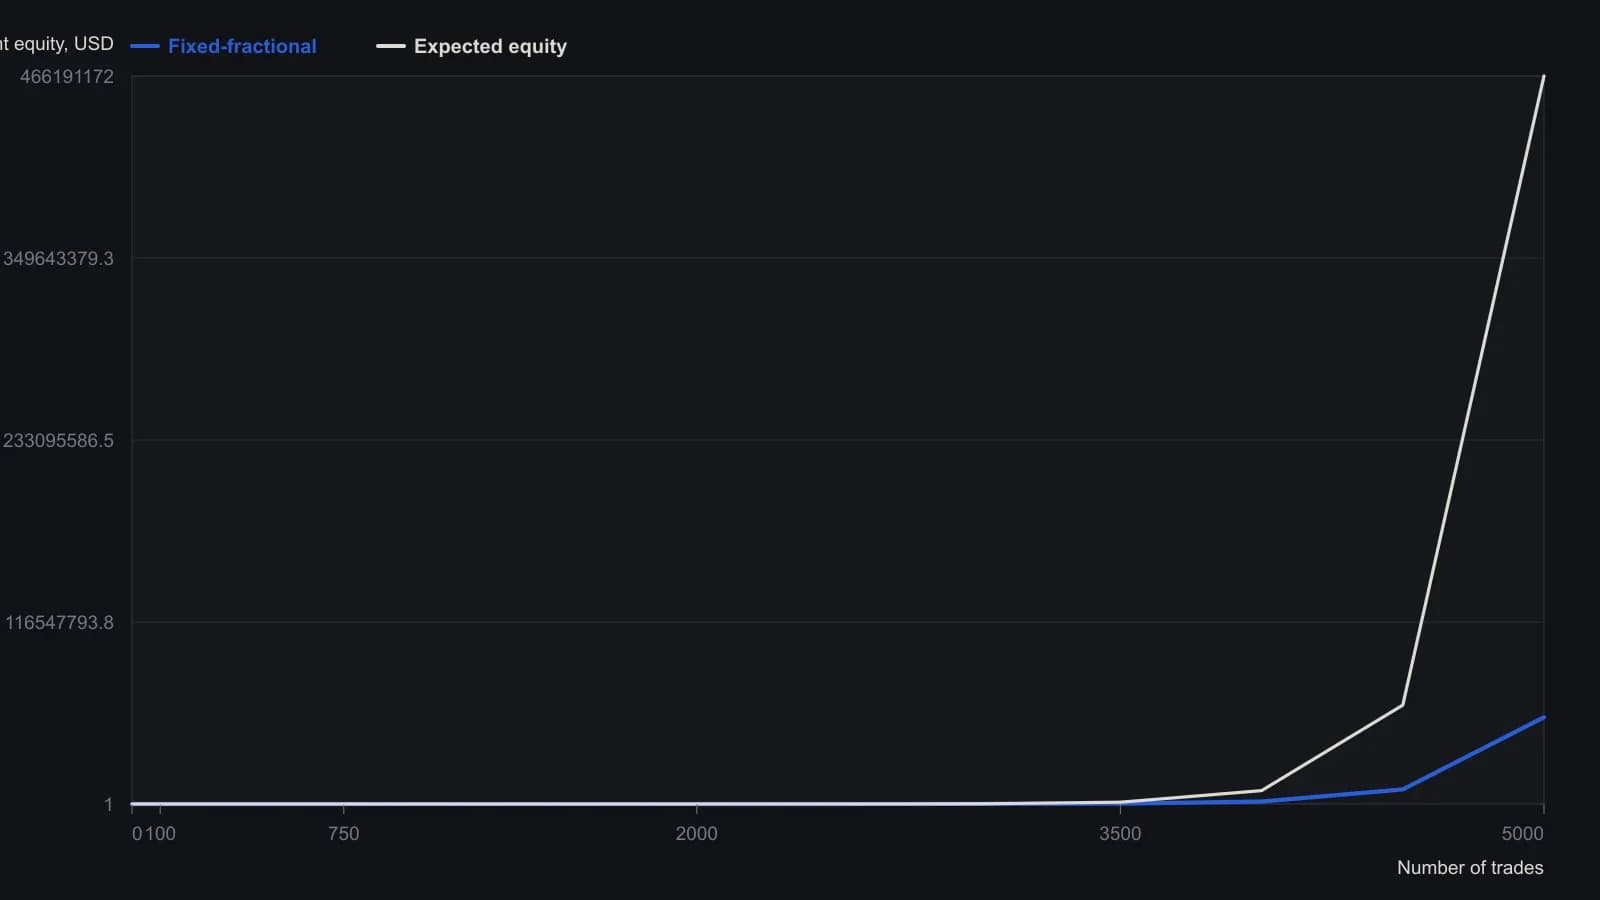
Win rate is 40 percent and payoff is 2-to-1, the worked example in the article. Figure 2's single 5,000-trade Monte Carlo path ended at $66.4 million for fixed-fractional and $617.7 million for expected fixed-fractional; those one-run endings are not the series plotted here.
Replace current equity with expected equity
Expected equity is the account path implied by compounding initial capital at one plus expected-value times the chosen risk fraction, independent of realized wins and losses.
Expected-equity sizing risks a constant fraction of expected equity, where expected equity equals initial equity times (1 + expected-value times the fixed fraction) raised to the trade index N.
The same fraction in a monte-carlo-simulation
A monte-carlo-simulation is a repeated resampling of an ordered sequence of wins and losses over a stated trial count, used to compare live-equity sizing with expected-equity sizing.
In a 5,000-trade monte-carlo-simulation of the first system, expected-equity sizing produced a deeper maximum drawdown of about 50 percent versus about 40 percent for live-equity fractional sizing.
That monte-carlo-simulation histogram counted 962 new equity highs for expected-equity sizing versus 641 for live-equity sizing, and 44 expected-equity cases with drawdowns between 40 percent and 50 percent.
Three systems that share the same expectancy
Three 5,000-trial monte-carlo-simulation systems that share expected-value 0.2 and a 2 percent fraction, with win rates of 40, 50, and 60 percent, all ended higher under expected-equity sizing.
Peak drawdowns were close for the 50 percent and 60 percent win-rate cases.
All readings on this track · 21 readings
- 1987Volatility-layered mechanical system with fixed contracts
- 1994Starting capital from worst-case portfolio walk-forwards
- 1994Bound small-account risk before adding leverage
- 1996Variable position size after entry
- 1996Equity path filters for contract size and drawdown
- 1997Stop distance, equity caps, and trading halts
- 1999Size-matched buy-and-hold evaluation for stock systems
- 2002Size from stop distance to keep dollar risk even
- 2003Share size from daily profit equilibrium
- 2004Half-size energy futures as a pre-trade leverage filter
- 2007Equalizing contract risk in trend following
- 2007Expected-equity sizing and geometric drag
- 2007Predefine the loss before fixed contract sizing
- 2013Weekday, session, and market expectancy for contract size
- 2014Bounded leverage before you size a trade
- 2015Equal-dollar futures size and open-interest liquidity
- 2015Atomize trading decisions: discipline over complexity
- 2017Tiny bets, ruin risk, and mechanical scale
- 2018Near-strike weekly puts and unfunded assignment risk
- 2019Paper trading is unfinished without fill and size rules
- 2019Constructing futures leverage from margin and fixed size