1992issue C031-9
Constructing fractal templates from successive index changes
A checkable fractal template is built from differenced and rescaled successive index or breadth changes. A chart shape is treated as a hypothesis only after roughness is kept, transformed, and retested rather than smoothed away.
- Market indices can be treated as the output of a nonlinear dynamic system, so a small change in one variable can have a nonproportional effect on other variables and on the path of the whole system.
- Fractal analysis treats jagged roughness as an essential property of the system instead of as leftover error around a fitted line, moving average, or band.
- Successive hourly advance counts are differenced, rescaled, blocked into session windows, and thinned by a random draw before the plot is inspected for W-shaped and M-shaped forms.
- Candidate templates are checked for reappearance, and any forecast role depends on preceding templates rather than on a one-pattern, one-move code.
A template starts after the series is transformed
Pattern recognition, in this construction, is not a search for a raw chart picture. It is a search for an explicit template in ordered price, volume, or breadth observations after the series has been differenced and rescaled.
Market indices can be treated as the output of a nonlinear dynamic system. Variables do not move in simple proportion, so a small change in one input can produce a much larger change in other variables and in the path of the whole system.
Writing nonlinear differential equations to forecast stock-index output is presented as one complementary route. That equation-building is described as unsuccessful to date. Fractal analysis is used instead to keep jagged structure as an essential property of the system.
Chaos, roughness, and scale
In the chaotic framing used here, an input maps to a bounded region of solutions rather than to one value plus noise. That region can show self-similar structure across scales. Chaos is deterministic motion that stays inside a bounded region while still looking irregular from the outside.
A fractal is a form that keeps a similar structure when examined at different measurement scales. Roughness is the jagged remainder of a series after any trend sketch. Here roughness is treated as system information rather than leftover error.
Fractal statistics uses sampling, rescaling, or standardization to measure that roughness without replacing it by a line, curve, or cycle.
What a fixed reading can hide
Indicators locked to a fixed bar count can assign the same reading to price paths that are structurally different.
A cycle-plus-noise model is described as incomplete for nonlinear behaviors that include drift toward a point, intermittent repetition, and complicated bounded attractors.
Fractal analysis treats jagged structure as an essential property of the system instead of as residual noise around a fitted line, moving average, or band.
A worked successive-change construction
In the worked construction, successive hourly advance counts are differenced. Those differences are rescaled against expected hourly differences. The rescaled series is then blocked into morning, midday, and late-afternoon windows. From each block, one observation is drawn at random.
That random draw is the Monte Carlo simulation step. It is used to thin short-term dependence while leaving the transformed series intact for later testing.
The rescaling itself is a contractive affine transformation: a paired rescaling in which the amplitude axis and the time axis are stretched or compressed by different ratios, often with the time axis contracted in successive halves or blocks.
After that affine rescaling, a simulated plot is inspected for a W-shaped form near a short-term low and an M-shaped form near a short-term high. A fractal template is that repeatable building-block shape, recovered after one or more affine transformations and later checked for reappearance.
A fractal indicator, if used later, would take a signal from such a repeatable transformed-structure condition at a chosen chart scale.
Up hours and down hours as two controls
Separate contractive transformations on sequences of up hours and down hours are used to represent a two-control system. Up sequences and down sequences are studied separately, as if buyers and sellers were distinct controls.
No single transformation set is treated as uniquely correct.
Rescaled successive NYSE advance differences by hour
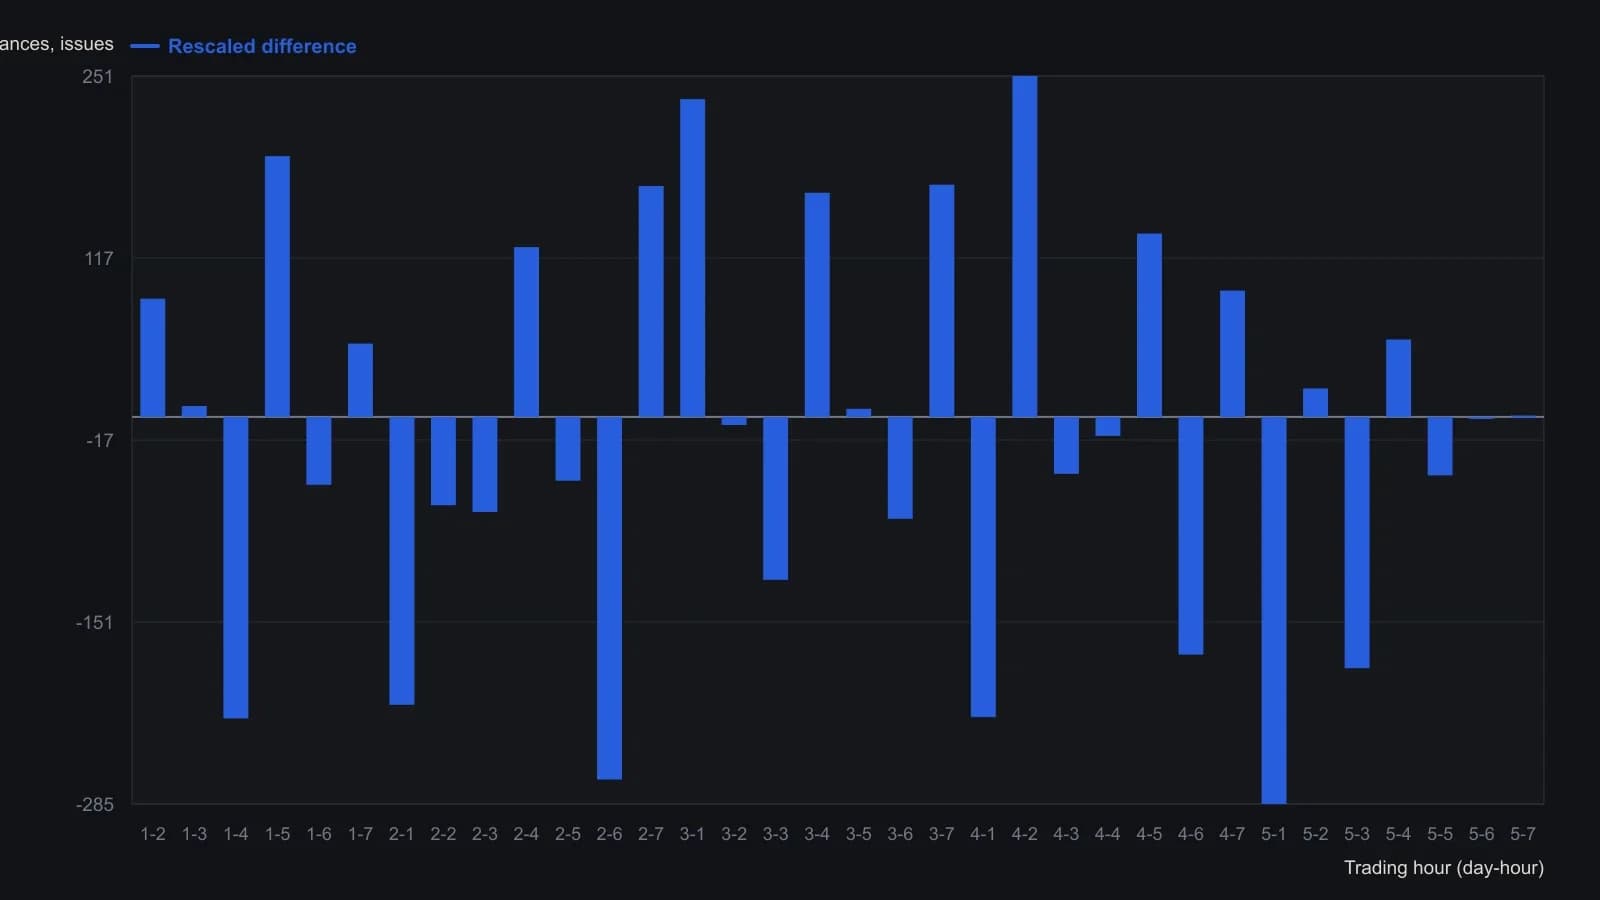
Hour 1 of each day has no successive difference; expected difference is the hour-specific mean the source applied before rescaling.
Rechecking a template before any forecast role
Candidate templates are checked for reappearance in the historical sample. Pattern recognition then compares the explicit template with later occurrences.
Any forecast role is treated as dependent on preceding templates rather than as a one-pattern, one-move code.
Editorial interpretation: the recovered M-shaped or W-shaped form is not a finished rule that turns one shape into one later move. It is a constructed template that must reappear, and any forecast comparison is read in the context of the templates that came before it.
All readings on this track · 7 readings
- 1992Constructing fractal templates from successive index changes
- 1994Constructing polarized fractal efficiency as a path filter
- 2002Long memory, regimes, and the limits of bell-curve models
- 2003Constructing the fractal dimension index
- 2005Constructing a fractal-dimension adaptive moving average
- 2007Constructing a fractal-dimension regime filter
- 2015Constructing fractal swings as support-resistance atoms