2015issue C0162-64
Equal-dollar futures size and open-interest liquidity
Editorial. Read the archive as a two-gate pre-trade checklist: convert every futures name into an equal-dollar contract count from a three-year price range, then use an open-interest-weighted liquidity rank to accept or reject that size before the order is sent.
- Futures can be placed on an equal-dollar-profit scale by multiplying contract value by the largest price change observed over the prior three years, so each resulting contract count represents the same dollar value.
- Relative contract liquidity is ordered by multiplying the equal-dollar contract count by total open interest and by a volume factor that is usually set between 1 and 4.
- Effective percent margin equals the dollar margin divided by the contract's three-year dollar price range, then multiplied by 100.
- Each comparison column is a proportional measure and is meaningful only relative to other contracts in that same column.
Equal-dollar contract counts
Futures can be placed on an equal-dollar-profit scale by multiplying contract value by the largest price change observed over the prior three years, so each resulting contract count represents the same dollar value.
The equal-dollar contract count equals the tick's dollar value multiplied by the three-year maximum price excursion. It is how many contracts of one future match another future's three-year dollar price excursion.
Effective percent margin
Effective percent margin equals the dollar margin divided by the contract's three-year dollar price range, then multiplied by 100. It is posted margin dollars expressed as a percentage of the contract's three-year dollar range.
Relative contract liquidity
A futures liquidity ranking can be built by multiplying contract point value, a three-year maximum price motion, open interest, and a volume factor that is usually set between 1 and 4.
Relative contract liquidity can be ordered by multiplying the equal-dollar contract count by total open interest and by a volume factor. That construction is a descending rank built from equal-dollar size, total open interest, and a volume factor.
The volume factor is the greater of 1 and the exponential of the natural log of volume divided by the natural log of 5,000, minus 2. It is a floor-at-one scaler based on how far volume sits above a 5,000-contract logarithmic baseline.
Each comparison column is a proportional measure and is meaningful only relative to other contracts in that same column.
Illustrated equal-dollar counts
In the illustrated ranking, 5 E-mini S&P 500 contracts, 163 two-year Treasury-note contracts, and 196 Eurodollar contracts were the counts required for equal dollar profit.
A share-turnover proxy
For listed shares, period volume as a percentage of shares outstanding was treated as a turnover-rate proxy for trading liquidity. That share-turnover proxy is period volume divided by shares outstanding, used as a stand-in for equity trading liquidity.
Equal-dollar futures contract counts
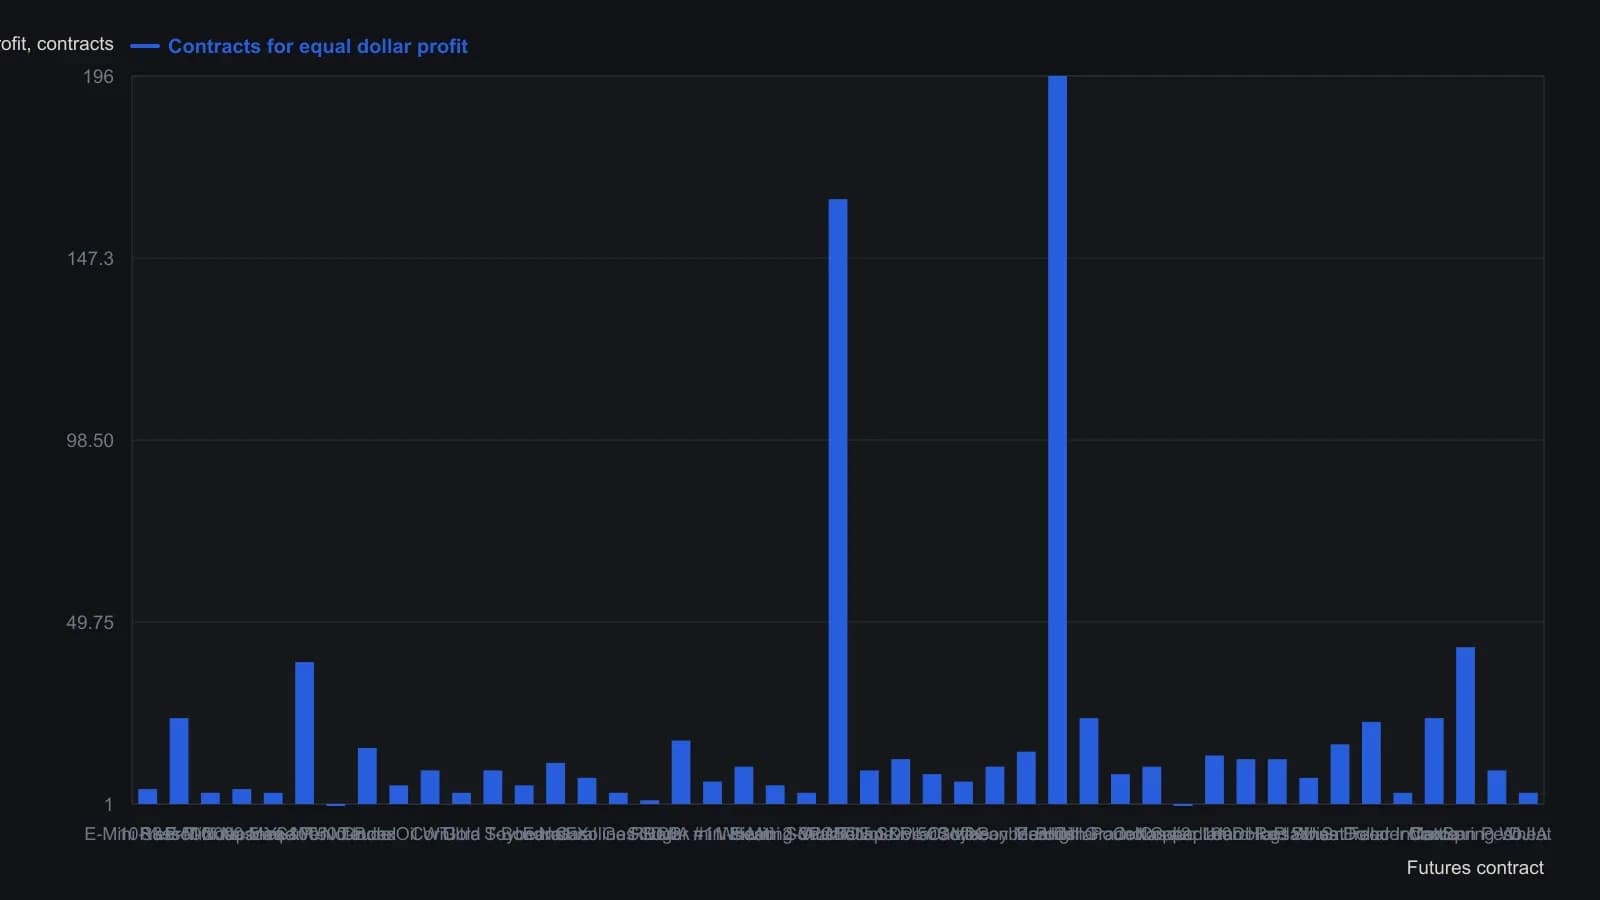
Rows stay in the magazine's relative-liquidity order (these counts times open interest times a volume factor). Liquidity itself is printed only as dots, so it is not plotted.
All readings on this track · 21 readings
- 1987Volatility-layered mechanical system with fixed contracts
- 1994Starting capital from worst-case portfolio walk-forwards
- 1994Bound small-account risk before adding leverage
- 1996Variable position size after entry
- 1996Equity path filters for contract size and drawdown
- 1997Stop distance, equity caps, and trading halts
- 1999Size-matched buy-and-hold evaluation for stock systems
- 2002Size from stop distance to keep dollar risk even
- 2003Share size from daily profit equilibrium
- 2004Half-size energy futures as a pre-trade leverage filter
- 2007Equalizing contract risk in trend following
- 2007Expected-equity sizing and geometric drag
- 2007Predefine the loss before fixed contract sizing
- 2013Weekday, session, and market expectancy for contract size
- 2014Bounded leverage before you size a trade
- 2015Equal-dollar futures size and open-interest liquidity
- 2015Atomize trading decisions: discipline over complexity
- 2017Tiny bets, ruin risk, and mechanical scale
- 2018Near-strike weekly puts and unfunded assignment risk
- 2019Paper trading is unfinished without fill and size rules
- 2019Constructing futures leverage from margin and fixed size