1991issue C011-9
Constructing tick engines to match price-change histograms
A three-outcome Monte Carlo tick engine with a stated session length and a discrete tick size generates synthetic daily charts. The close-to-close tick histogram is the test that decides whether that engine matches a designed density or an observed series.
- A scaled uniform increment on each close produces wiggly paths that fail a visual resemblance test against typical daily listed-price charts.
- A three-outcome Monte Carlo tick engine with a stated session length and a discrete eighth-point tick can generate families of synthetic daily charts that share common statistics.
- The close-to-close tick histogram is the acceptance test: static one-third odds only loosely match their own theoretical density and miss the sharper center and heavier tails of listed and futures series.
- State-dependent transition odds flatten the simulated center, hidden overnight ticks restore open gaps, and repeated matching paths can form a synthetic envelope.
Specify the tick engine
Adding a scaled uniform random increment to each close produces wiggly paths. Those paths fail a visual resemblance test against typical daily listed-price charts.
A Monte Carlo tick engine is a generator that draws each transaction from a stated set of up, unchanged, and down outcomes and compounds those draws into a daily close. Each move is a three-outcome tick: it can rise one tick, fall one tick, or stay unchanged, with probabilities that each stay below one and sum to one.
Session length is the number of transactions allowed to occur before one simulated day is closed. With a fixed transaction count per day and a discrete eighth-point tick, that engine can generate families of synthetic daily charts that share common statistics.
Test the static probabilities
One documented parameter set used 20 transactions per session and equal one-third probabilities for the three outcomes. The matching theoretical density can be computed directly from those parameters.
Two independent 800-session Monte Carlo runs under those static probabilities only loosely match the theoretical density. The difference is sampling scatter around the designed histogram.
Use the close-to-close histogram
A close-to-close tick histogram is a density of successive closing changes, expressed in ticks, used to compare a designed generator with observed series.
Close-to-close tick-change histograms from 400 to 500 sessions of listed equities, and from multi-year currency and deposit-rate futures, share a similar empirical shape. That shape has a sharper center and heavier tails than the Poisson-like densities of the constant-probability engine.
ASA close-to-close tick histogram
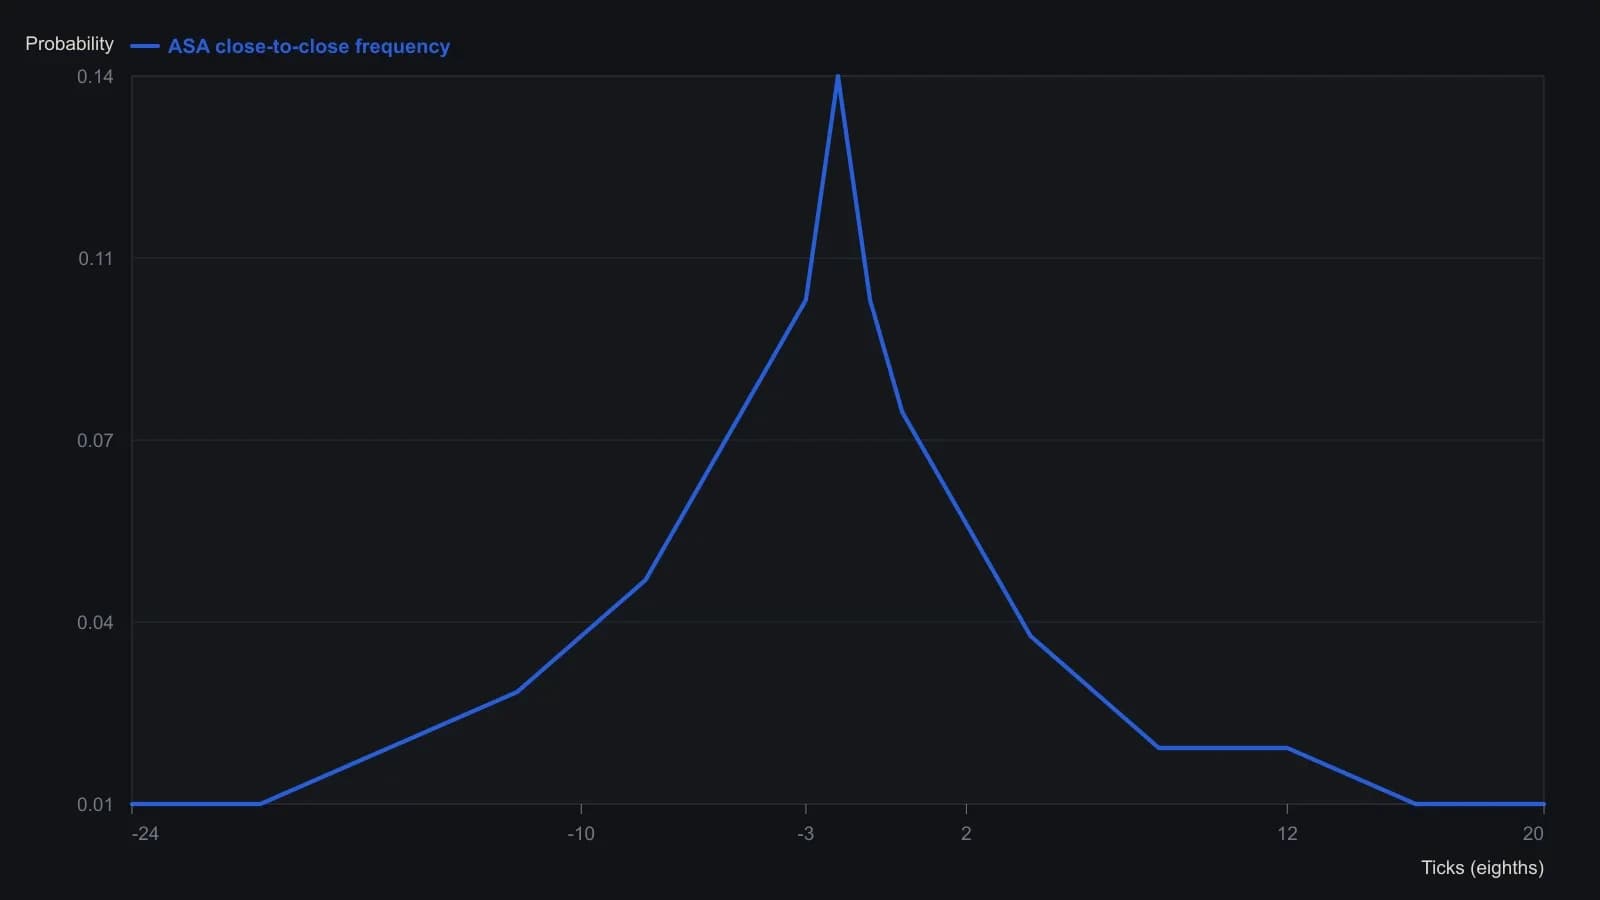
Harris defines a tick as (today’s close minus yesterday’s close) times 8. He says yen and Eurodollar samples have the same general shape; this figure is the ASA sample only. Heights are approximate reads from a coarse CGA screen dump.
Make the next-tick odds depend on direction
State-dependent transition odds are probabilities that shift with recent direction, raising the chance of a reversal near a flat net change and the chance of continuation after a large one-way run. Making the next-tick odds depend on recent direction flattened the simulated histogram's center relative to the static case but still underproduced extreme tail events.
Restore open gaps without rewriting the day
Setting each open equal to the prior close suppresses gaps. Hidden overnight ticks are unreported transactions applied only to the next open so that a gap can appear between one session and the next. Adding 10 unreported overnight transactions can insert occasional open gaps without changing the daytime tick engine.
Keep a reference envelope
Once a generator approximately matches a series' change histogram, repeated synthetic paths can form a synthetic envelope. That envelope is a band formed from many Monte Carlo paths that share the same statistical design, used later to notice when a live series has left that design. A specialist-rule layer on random order flow can be used to vary the resulting charts.
All readings on this track · 7 readings
- 1986Constructing price-change density histograms and symmetry tests
- 1986Calendar-locked averaging of price-change histogram categories
- 1986Chi-square test for clustered price-change histograms
- 1988Empirical price-change counts versus borrowed statistics
- 1991Constructing tick engines to match price-change histograms
- 1996Constructing a price occupancy histogram and a smoothed mobility reading
- 2003Treat an opening gap as a completed session event