1994issue C041-10
Starting capital from worst-case portfolio walk-forwards
The historical workflow set a 2 percent per-trade cap and a 35 percent overall-capital cap first, then replaced a single-date capital figure with a walk-forward distribution of required starting capital.
- A 2 percent per-trade cap and a 35 percent overall-capital cap were set as simultaneous exposure bounds before any start-date capital study.
- A single January 1 1981 start produced a 5459 capital-required figure that the same study later treated as an optimistic artifact of a favorable start date.
- Consecutive daily starts through 1990 produced an average capital requirement of 10576 and a standard deviation of 2049, which pushed a conservative start band to at least 17000 to 19000.
- The same 2 percent per-position rule on a 25000 account forced many signals to be skipped because initial risk exceeded 500.
Exposure bounds came first
A 2 percent per-trade cap and a 35 percent overall-capital cap were specified as simultaneous exposure bounds before any start-date capital study.
Editorial note: TradersWeek maps that setup onto Fixed contract sizing, Risk of ruin, and Drawdown limit. Those filters keep a loss or exposure decision bounded before a trade is placed and throughout the position. The archive describes the caps and the later capital study without assigning those method names.
A loss streak was not treated as proof
Multiplying one observed streak of 13 losses by an average loss of 1455 plus a 3000 margin buffer produced a 21915 starting-capital estimate that the text rejects as under-supported.
One start date was later treated as favorable
A single January 1 1981 start produced a 5459 capital-required figure that the same study later treated as an optimistic artifact of a favorable start date.
Repeating the portfolio simulation from consecutive daily starts through 1990 produced an average capital requirement of 10576 with a standard deviation of 2049.
Starting capital from one date versus walk-forward starts
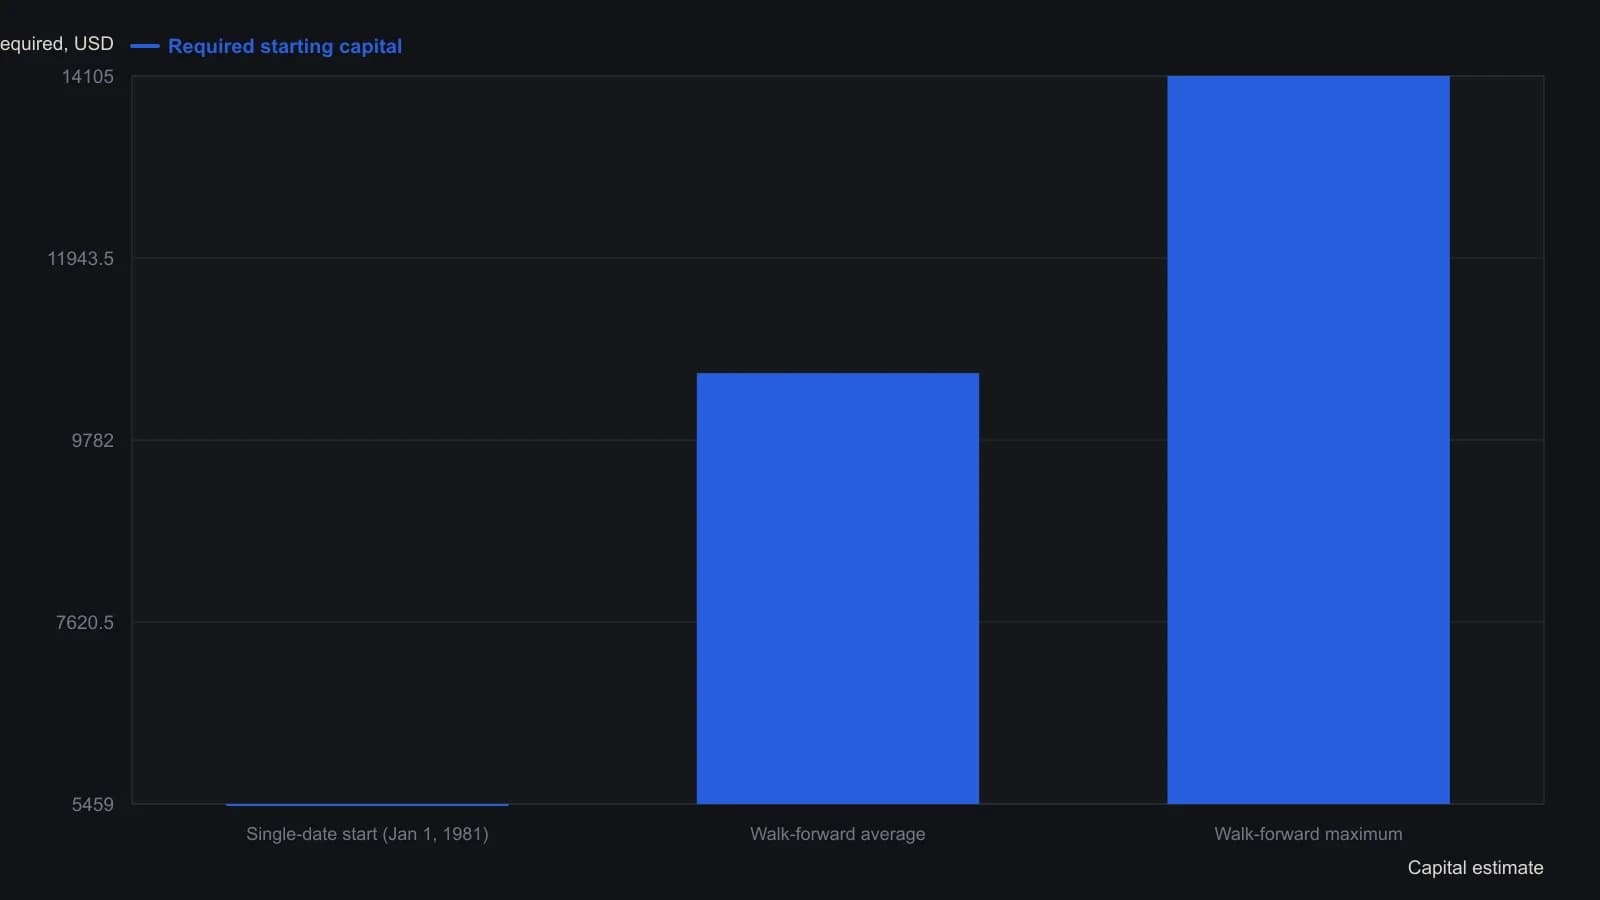
Walk-forward starts after the end of 1990 were dropped because they covered less than a year. Each run used a 2 percent per-trade cap, a 35 percent overall-capital cap, six-tick slippage and a $50 commission.
A small shortfall chance was still rejected
Under a normality assumption, 14105 of starting capital left about a 4 percent chance of still being underfunded, which the text called unacceptable.
Planning for a three- or four-standard-deviation shortfall, rather than the 1.75-sigma 14105 level, raised the conservative start band to at least 17000 to 19000.
Editorial note: TradersWeek reads the refusal to accept that remaining underfunded chance as a Risk of ruin filter, and the higher start band as a Drawdown limit on opening capital. The archive reports the figures without those labels.
The same cap skipped signals
The same 2 percent per-position rule on a 25000 account forced many signals to be skipped because initial risk exceeded 500.
Editorial note: TradersWeek reads that skip rule as Fixed contract sizing applied before entry.
All readings on this track · 21 readings
- 1987Volatility-layered mechanical system with fixed contracts
- 1994Starting capital from worst-case portfolio walk-forwards
- 1994Bound small-account risk before adding leverage
- 1996Variable position size after entry
- 1996Equity path filters for contract size and drawdown
- 1997Stop distance, equity caps, and trading halts
- 1999Size-matched buy-and-hold evaluation for stock systems
- 2002Size from stop distance to keep dollar risk even
- 2003Share size from daily profit equilibrium
- 2004Half-size energy futures as a pre-trade leverage filter
- 2007Equalizing contract risk in trend following
- 2007Expected-equity sizing and geometric drag
- 2007Predefine the loss before fixed contract sizing
- 2013Weekday, session, and market expectancy for contract size
- 2014Bounded leverage before you size a trade
- 2015Equal-dollar futures size and open-interest liquidity
- 2015Atomize trading decisions: discipline over complexity
- 2017Tiny bets, ruin risk, and mechanical scale
- 2018Near-strike weekly puts and unfunded assignment risk
- 2019Paper trading is unfinished without fill and size rules
- 2019Constructing futures leverage from margin and fixed size