1991issue C121-8
An eclipse calendar as a testable cycle scaffold
Dated Sun-Moon-Earth alignments are used here as a sampling grid on an ordered price series. Lock the event times, test inversions at the event, the half-span, or the third-span, and only then let a seasonal-filter and a same-scale geometric-overlay accept or reject the next mark as a signal.
- Lock publicly dated eclipse and near-eclipse times first, then test whether price inverted at the event, the half-span, or the third-span.
- A dominant-cycle is inferred from those dated marks on an ordered price series and is used to project the next inversion-point.
- An eclipse-cluster and time of year form a seasonal-filter that can confirm, weaken, or veto an event-timed mark.
- A geometric-overlay of cycle lines and trendlines on the same chart scale accepts or rejects the next mark only after the calendar and inversion tests are in place.
Lock the calendar before the signal
Editorial note: TradersWeek reads a publicly dated alignment calendar as a sampling grid, not as an omen. Event times are locked first. Price is then inspected for inversion at the event, the half-span, or the third-span. Only after that inspection may later filters accept the next mark as a signal.
In the archive workflow, eclipses are treated as Sun-Moon-Earth alignments that occur when the Moon is near the ecliptic. The lunar orbit is inclined about five degrees and crosses that plane at two nodes.
Two mean intervals and a physical sketch
Two mean lunar periods are specified. The draconic-interval is the mean time from one lunar node crossing of the ecliptic to the next corresponding crossing, given as 27.212221 days. The synodic-interval is the mean time from one Sun-Moon alignment, new or full, to the next, given as 29.530589 days. Ordinary lunations occur off the ecliptic.
The mechanistic sketch treats orbiting bodies as raising tidal swirls in solar gases that modulate radiation and solar-wind particles. Those particles then shape Earth's magnetopause, magnetotail, and polar ionization.
Solar eclipses are described as the Moon sitting outside the dayside bow wave and blocking inbound energy at alignment. Lunar eclipses are described as the Moon sitting in the nightside plasma sheet and briefly stopping reflected ionized particles. A near-eclipse is an approximate Sun-Moon-Earth alignment that falls short of a full eclipse but is treated as a related energy-flow event.
How past eclipses were classified
A review of eclipses from 1900 onward on a major industrial average classified each event as no effect, a move under 10 percent, or a larger move. The spreadsheet stored move size, duration, time of year, and other alignments.
That classification labeled 51 percent of all eclipses as coincident with a move, split as 18 percent larger and 33 percent smaller. Clustered events exceeded a 90 percent labeled-effect rate. An eclipse-cluster is a compact group of solar, lunar, and near alignments handled as one seasonal window rather than isolated dates.
Solar events were tabulated more than 10 percentage points more often in the combined-move class than lunar events. Near-alignments were treated as potentially as relevant as full eclipses.
Dow Jones, February 1932–March 1933, with eclipse event marks
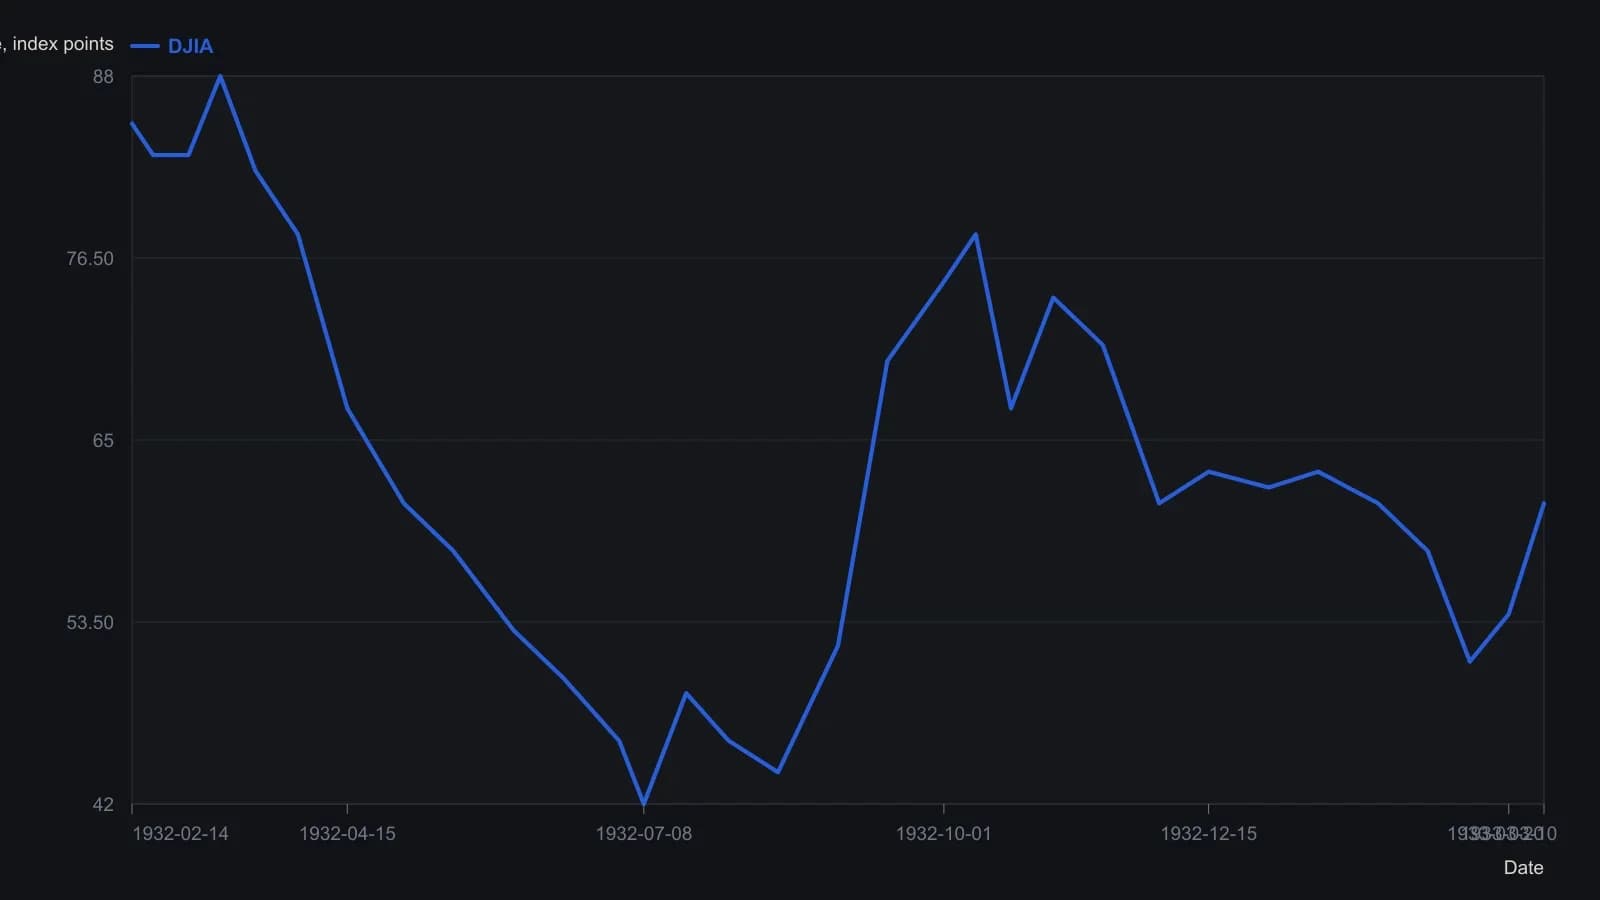
Y-values are approximate readings from the printed raster (axis ticks at 38, 44, 49, 54, 60, 65, 71, 76, 82, 87). Eclipse marks are event times only and are not a second series.
Cycle lines and inversion-points
The working procedure marks eclipse times on a price chart, connects them with a straight cycle line, inserts inversions at midpoints or third-points, and uses those marks with geometric trendlines to anticipate the next event.
A dominant-cycle is a repeating interval inferred from dated event marks on an ordered price series and used to project the next inversion. An inversion-point is a hypothesized cycle turn inserted at the midpoint or third-point between two marked events. A geometric-overlay is the set of straight cycle lines and trendlines drawn on the same chart scale as the event marks to test a repeatable geometric turn hypothesis.
Two illustrated sessions
One illustrated session on 7 August 1990 showed an opening decline of more than 100 points that halted near 10:15, with a lunar-eclipse peak listed at 10:10 that morning.
A July 1991 Nikkei example was presented as following a half-eclipse-rhythm, turning at near-eclipses and at the halfway marks between them. A half-eclipse-rhythm is a working hypothesis that turns occur at eclipses or near-eclipses and at the midpoint between them.
Later gates, not first causes
Editorial note: the archive stored time of year and other alignments with each classified event. TradersWeek treats that record as a seasonal-filter, meaning time of year used with other concurrent alignments as a rule input that can confirm, weaken, or veto an event-timed signal.
Editorial note: the geometric-overlay is the second gate. Straight cycle lines and trendlines stay on the same chart scale as the event marks. They do not replace the dated calendar. They only accept or reject the next hypothesized turn after the inversion test has been stated.
All readings on this track · 34 readings
- 1984Range grid to sideways break in 1984 gold
- 1985When Gann lines, Gann angles, and a Fibonacci retracement coincide
- 1987Evaluating angular cycle overlays on independent stock swings
- 1988Multi-scale Elliott counts with Gann and Fibonacci confluence
- 1988Gann angles as hand-scaled chart geometry
- 1989A time, price, and pattern filter on one platinum sequence
- 1989Gann angles on point-and-figure grids
- 1990Gann price-time clusters for Elliott retracements
- 1990Channel regimes and Gann angle hinges
- 1990A gold campaign log as a trade procedure
- 1991A fourth Treasury bond resistance test as one time-price hypothesis
- 1991An eclipse calendar as a testable cycle scaffold
- 1992Gann-angle intersections and half-range zones
- 1998Wave and ratio self-similarity as a testable chart hypothesis
- 2000Constructing Gann fan angles from swing extremes
- 2002Combining Fibonacci retracement, Gann angles, and the moving average in FX
- 2002Halfway retracement as a trend confirmation filter
- 2006Volume distribution, Fibonacci extensions, and Gann angles on one downswing
- 2007Constructing Gann fans as currency support and resistance
- 2010ABC completion, wave-two windows, and Gann ratios
- 2010Constructing a Gann, Fibonacci, and decade-scale reversal cluster
- 2010Gann angles as timed tests that still need structure and RSI
- 2010Gann angles heritage is not a signal
- 2010Gann-fan time windows confirmed by Elliott-wave position
- 2010Gann angles as a repeatable chart hypothesis
- 2011Wave and ratio overlays as confirmation, not forecasts
- 2013Gold wave four as a time and price cluster check
- 2014A case study that separates cycle forecasts from Gann and Elliott readings
- 2014Relative charting, Gann angles, and trendline breakouts
- 2016Gann fans and a 2016 long-wave case as checkpoints, not forecasts
- 2017Gann angles, scale dependence, and the gap between legend and method
- 2017Gann angles as overlay, not original practice
- 2018Combine Gann angles, oscillator zones, and a protective stop
- 2020Confirming Gann hi-lo swings with ADX and stochastics