1988issue C021-5
Multi-scale Elliott counts with Gann and Fibonacci confluence
Keep several compressions of one hourly series so intermediate, minor, and minute Elliott structure stay visible. A Gann angle from a labeled high or low is treated as occupying an Elliott retracement in almost every case, which turns that overlap into a single testable price and a clearer exit if it fails.
- Wave-magnitude is isolated by compressing the same hourly series until intermediate, minor, or minute structure is readable.
- Elliott-wave objectives use the ratios 0.618, 0.5, 0.382, and 0.236; penetration of one retracement is a cue to look for support at the next.
- A Gann angle from a significant high or low is described as intersecting those retracements in almost every case, giving a more definite entry and a clearer exit if the overlap fails.
- Hourly index levels were treated as actual prints and usable for Gann work; daily highs and lows were not, because they were not simultaneous.
Keep every wave-magnitude in view
Elliott-wave analysis is the hierarchical labeling of impulsive and corrective price swings. The labels imply later structure and ratio-based objectives.
Wave-magnitude is the size of a labeled swing. It is isolated by compressing or expanding the same hourly series until intermediate, minor, or minute structure is readable. The most compressed view showed intermediate waves. A less compressed view showed minor waves. The uncompressed hourly chart retained minute detail.
Daily index highs and lows were treated as unusable for Gann projections because they were not simultaneous prints. Hourly index levels were treated as actual values and therefore usable.
Ratio objectives and a sequential plan
Elliott-wave price objectives are built from the ratios 0.618, 0.5, 0.382, and 0.236. A fibonacci-retracement is a pullback objective taken as a fixed fraction of a completed swing. Penetration of one retracement is treated as a cue to look for support at the next ratio.
A sequential plan to buy a halt at a 0.382 retracement, exit if that level breaks, then repeat at 0.5 and if needed at 0.618 is described as intellectually simple but emotionally impractical for most traders.
A Gann angle on the same price
A gann-angle is a geometric price-time line drawn from a significant high or low, expressed as a ratio such as 1×1, 2×1, or 1×4. A Gann line from a significant high or low is described as intersecting an Elliott retracement in almost every case. That overlap is confluence: a price where a Gann angle and an Elliott or Fibonacci retracement land together and can be treated as a single testable level. The overlap is described as giving a more definite entry price and a clearer exit if it fails.
A 1×1, or 45-degree, Gann line need not appear as a 45-degree slope when software rescales the line to the amount of data and the number of days on screen. A Gann line left unviolated for longer is treated as stronger support or resistance. The crossing of several Gann lines is treated as a more probable turning area.
A working hourly count in late August 1987
In late August 1987 the working hourly count labeled the fifth wave of Intermediate Wave 3 complete in mid-June and expected a multi-week Intermediate Wave 4. A 2×1 Gann line from the May 20 low at 2205 reached 2465 on August 27, matching the 50 percent retracement of a 527-point rise to 2732. The 38.2 percent, 50 percent, and 61.8 percent levels were at 2530, 2468, and 2406.
DJIA 38.2%, 50% and 61.8% retracements of the May–August 1987 advance
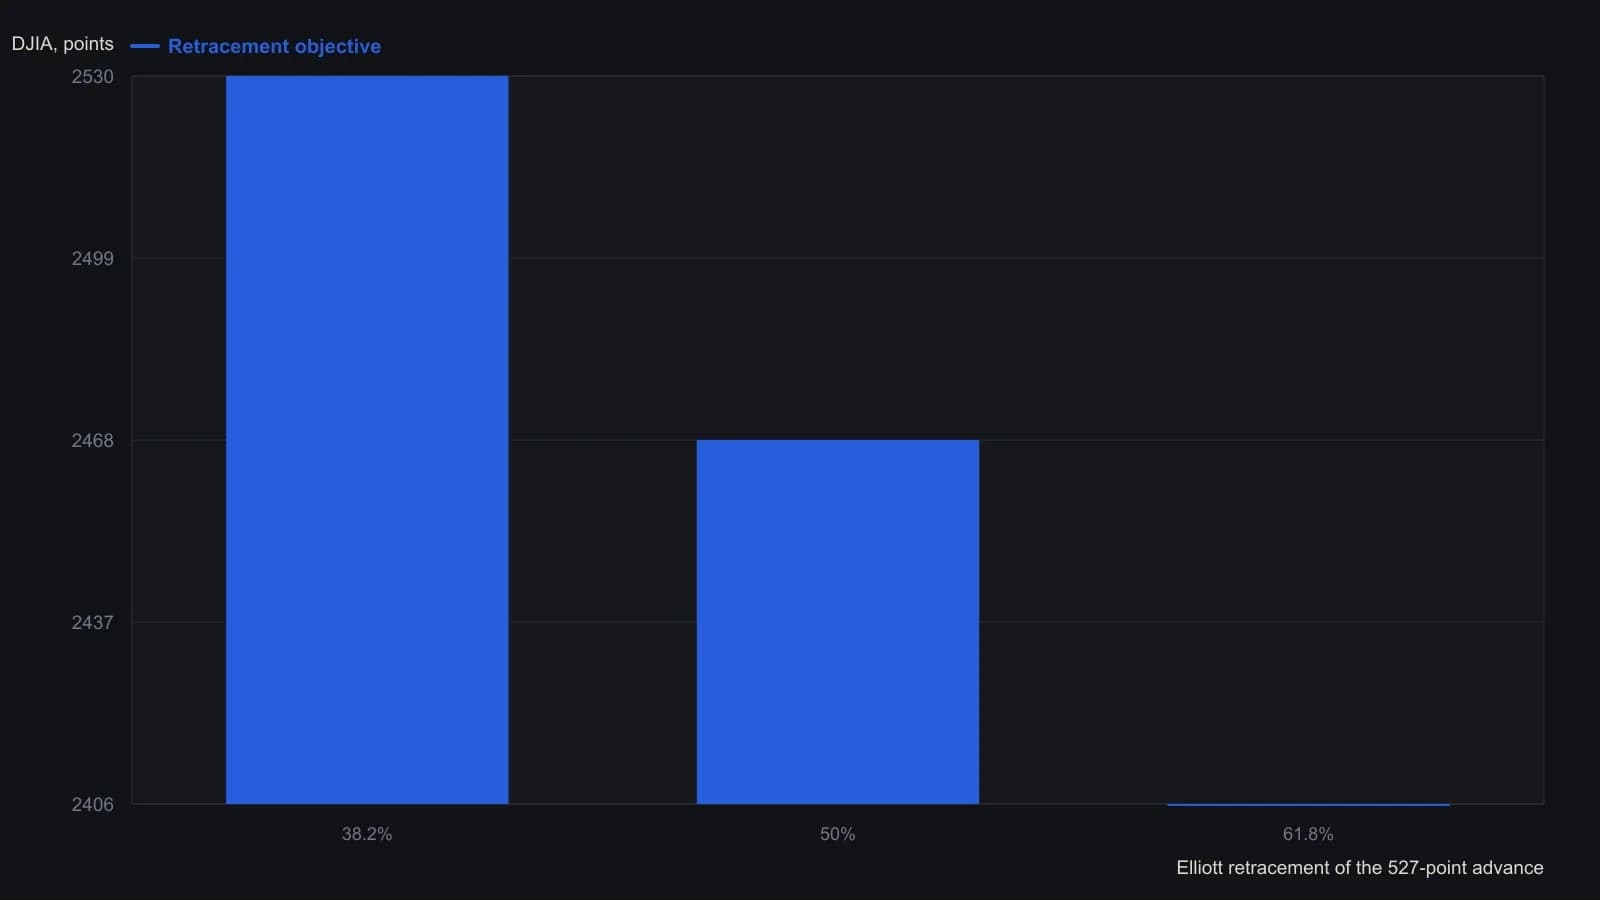
On these compressed hourly plots a 1×1 Gann angle is scaled to the data window and need not look like 45 degrees. The 2×1 from 2205 is quoted at 2465 on August 27 and rising one point per hour.
An alternate count and clustered Gann lines
An alternate count still placed a fifth-wave high at or just before 2732 and still implied a decline. On shorter hourly windows Intermediate Wave 5 was labeled complete in five subwaves, with A and B finished and C underway. Support was near 2639 to 2640, where several Gann lines met the prior minute-wave-4 low. The index bounced from a 2639 hourly low on August 28 to a 2684 hourly high before declining on September 1.
All readings on this track · 34 readings
- 1984Range grid to sideways break in 1984 gold
- 1985When Gann lines, Gann angles, and a Fibonacci retracement coincide
- 1987Evaluating angular cycle overlays on independent stock swings
- 1988Multi-scale Elliott counts with Gann and Fibonacci confluence
- 1988Gann angles as hand-scaled chart geometry
- 1989A time, price, and pattern filter on one platinum sequence
- 1989Gann angles on point-and-figure grids
- 1990Gann price-time clusters for Elliott retracements
- 1990Channel regimes and Gann angle hinges
- 1990A gold campaign log as a trade procedure
- 1991A fourth Treasury bond resistance test as one time-price hypothesis
- 1991An eclipse calendar as a testable cycle scaffold
- 1992Gann-angle intersections and half-range zones
- 1998Wave and ratio self-similarity as a testable chart hypothesis
- 2000Constructing Gann fan angles from swing extremes
- 2002Combining Fibonacci retracement, Gann angles, and the moving average in FX
- 2002Halfway retracement as a trend confirmation filter
- 2006Volume distribution, Fibonacci extensions, and Gann angles on one downswing
- 2007Constructing Gann fans as currency support and resistance
- 2010ABC completion, wave-two windows, and Gann ratios
- 2010Constructing a Gann, Fibonacci, and decade-scale reversal cluster
- 2010Gann angles as timed tests that still need structure and RSI
- 2010Gann angles heritage is not a signal
- 2010Gann-fan time windows confirmed by Elliott-wave position
- 2010Gann angles as a repeatable chart hypothesis
- 2011Wave and ratio overlays as confirmation, not forecasts
- 2013Gold wave four as a time and price cluster check
- 2014A case study that separates cycle forecasts from Gann and Elliott readings
- 2014Relative charting, Gann angles, and trendline breakouts
- 2016Gann fans and a 2016 long-wave case as checkpoints, not forecasts
- 2017Gann angles, scale dependence, and the gap between legend and method
- 2017Gann angles as overlay, not original practice
- 2018Combine Gann angles, oscillator zones, and a protective stop
- 2020Confirming Gann hi-lo swings with ADX and stochastics