2002issue C121-3
Halfway retracement as a trend confirmation filter
The halfway mark of a prior swing is a shared pass-fail gate. Gann angles, Fibonacci retracement, and support-resistance all test whether the next reaction recaptures half the prior range, so a student can keep, restart, or suspend a trend hypothesis.
- Treat the halfway level of a prior range as the first support or resistance checkpoint after a reaction, with the three-quarter and full-range marks ranked next.
- Confirm a downtrend only after two successive downswings and a later rally that misses the prior swing's 50 percent line.
- Mark pivots on a 5 percent price change, and draw 50 percent midpoint lines only on zigzags of seven bars or longer.
- Read a dip through the 50 percent line of the latest upswing as evidence that direction is unclear and that price may be moving sideways.
The shared halfway question
The halfway level of a prior range is treated as the first support or resistance checkpoint after a reaction. The three-quarter and full-range marks are ranked next.
A reaction is a counter-move against an advance, scored by how close it comes to the prior swing's midpoint. A rally is a counter-move against a decline, scored the same way and further judged by whether volume participates. The shared question is whether the next counter-move recaptured half the prior swing.
Three methods, one checkpoint
Gann angles are a scaled halfway construction on a completed swing used to test whether the next move respects the mid-range of that swing. Fibonacci retracement supplies measured pullback checkpoints, especially the midpoint and three-quarter rest of a prior range, used to judge whether a correction is still a reaction or a new impulse. Support-resistance marks zones at swing midpoints and failed reclaims that either defend the old direction or force a fresh swing count.
The three constructions differ in how they are drawn. They still score the same event: did the next reaction recapture half the prior swing?
What counts as a swing and a trend
A swing is a directional run long enough to measure, treated here as roughly seven bars or more and typically shorter than about two months. A trend is a sequence of swings in one direction whose later corrections fail the halfway test of the preceding impulse. Moves lasting less than about two months are classed as swings rather than trends. Two- or three-bar candlestick forms are treated as too short to confirm a trend.
A pivot is a turning point marked when price changes by a material amount, here a 5 percent move, so noise is not counted as structure. Pivots are marked on a 5 percent price change, and only zigzags of seven bars or longer receive 50 percent midpoint lines.
How the midpoint is plotted
The plotted midpoint shifts if the swing is measured from the two pivot closes instead of from the extreme high of the peak bar. In the TradersWeek editorial reading, the measurement rule should be kept fixed for a given swing so the pass-fail test is not moved after the fact.
Whether a rally or reaction has participation is judged by volume relative to a 20-period triangular average.
Keep, restart, or suspend the hypothesis
Two successive downswings plus a later rally that misses the prior swing's 50 percent line are treated as the confirmation sequence for a downtrend. That sequence keeps the downtrend hypothesis in force because the later correction failed the halfway test of the preceding impulse.
A higher pivot peak without a higher pivot valley is treated as only a partial break of a downtrend. A second upswing is required before a long setup on the following reaction. Until that second upswing appears, the old swing count is not fully replaced.
A dip through the 50 percent line of the latest upswing is treated as evidence that direction is unclear and that price may be moving sideways. That is the point at which the trend hypothesis is suspended rather than forced.
A short final downswing is treated as a warning that downside continuation is weakening when a later rally becomes a full upswing and clears the halfway mark. Clearing that mark restarts the count on the new impulse instead of treating the bounce as a routine rally.
Daily QQQ through the 2002 downtrend
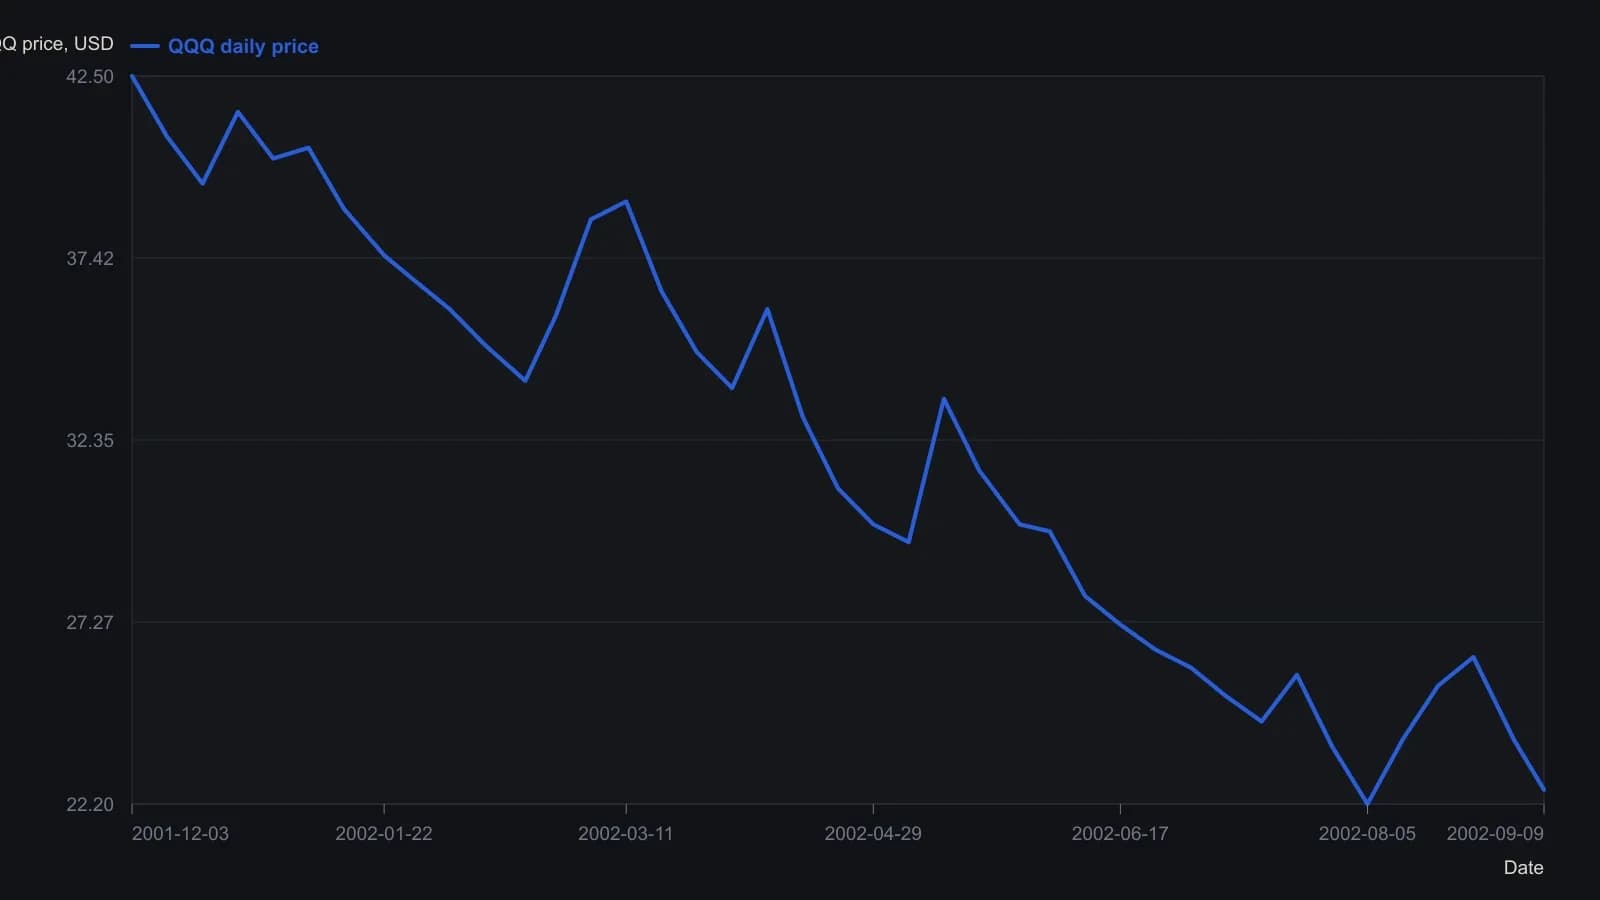
The source marks pivots with a 5% zigzag and draws 50% midpoints from pivot closes (and, on the first swing, from the highest high). Values are digitised from the raster and are only good to about half a point.
All readings on this track · 34 readings
- 1984Range grid to sideways break in 1984 gold
- 1985When Gann lines, Gann angles, and a Fibonacci retracement coincide
- 1987Evaluating angular cycle overlays on independent stock swings
- 1988Multi-scale Elliott counts with Gann and Fibonacci confluence
- 1988Gann angles as hand-scaled chart geometry
- 1989A time, price, and pattern filter on one platinum sequence
- 1989Gann angles on point-and-figure grids
- 1990Gann price-time clusters for Elliott retracements
- 1990Channel regimes and Gann angle hinges
- 1990A gold campaign log as a trade procedure
- 1991A fourth Treasury bond resistance test as one time-price hypothesis
- 1991An eclipse calendar as a testable cycle scaffold
- 1992Gann-angle intersections and half-range zones
- 1998Wave and ratio self-similarity as a testable chart hypothesis
- 2000Constructing Gann fan angles from swing extremes
- 2002Combining Fibonacci retracement, Gann angles, and the moving average in FX
- 2002Halfway retracement as a trend confirmation filter
- 2006Volume distribution, Fibonacci extensions, and Gann angles on one downswing
- 2007Constructing Gann fans as currency support and resistance
- 2010ABC completion, wave-two windows, and Gann ratios
- 2010Constructing a Gann, Fibonacci, and decade-scale reversal cluster
- 2010Gann angles as timed tests that still need structure and RSI
- 2010Gann angles heritage is not a signal
- 2010Gann-fan time windows confirmed by Elliott-wave position
- 2010Gann angles as a repeatable chart hypothesis
- 2011Wave and ratio overlays as confirmation, not forecasts
- 2013Gold wave four as a time and price cluster check
- 2014A case study that separates cycle forecasts from Gann and Elliott readings
- 2014Relative charting, Gann angles, and trendline breakouts
- 2016Gann fans and a 2016 long-wave case as checkpoints, not forecasts
- 2017Gann angles, scale dependence, and the gap between legend and method
- 2017Gann angles as overlay, not original practice
- 2018Combine Gann angles, oscillator zones, and a protective stop
- 2020Confirming Gann hi-lo swings with ADX and stochastics