2002issue C081-5
Combining Fibonacci retracement, Gann angles, and the moving average in FX
A 2002 currency-chart workflow used Fibonacci retracement as a first-pass map of pullbacks, then Gann angles to make that map more date- and angle-specific, then the moving average to check divergences on a short FX horizon.
- Daily currency work in the 2002 source began with typical Fibonacci retracement as a first-pass map of price pullbacks.
- Gann angles were added next so the map was more date- and angle-specific than Fibonacci levels alone.
- The moving average step looked for divergences and paired chosen calendar dates with chosen average lengths rather than standing as a lone overlay.
- On a day-to-day horizon the source ranked order flow and technicals above fundamentals, and treated currency technicals as shorter-horizon than the same tools in many other markets.
How the daily workflow was stacked
Daily currency technical work described in the 2002 source used typical Fibonacci retracement as a first-pass map of price pullbacks.
The same workflow then added Gann angles so the resulting map was more date- and angle-specific than Fibonacci levels alone.
A moving average was used next, with attention to divergences between averages or between the currency and its average. The moving-average step also combined chosen calendar dates with chosen average lengths rather than treating the average as a standalone overlay.
The FX setting that shaped the stack
On a day-to-day horizon the source ranked order flow and technicals above fundamentals, which were treated as a long-horizon backdrop rather than a daily timing tool.
Currency technicals were described as shorter-horizon than the same tools in many other markets, matching a 24-hour cash market that does not pause like a listed equity session.
Tradeable FX concentration was described as a small set of major pairs rather than a broad single-name universe, which the source tied to a more globally shared price tape.
The dollar-yen reference rate
A long-term dollar-yen chart was treated as having 120 as the most significant reference rate, with the pair again approaching that level after a 1995 low near 80 and a 1998 high near 146.
US Dollar Index, 1993–2002
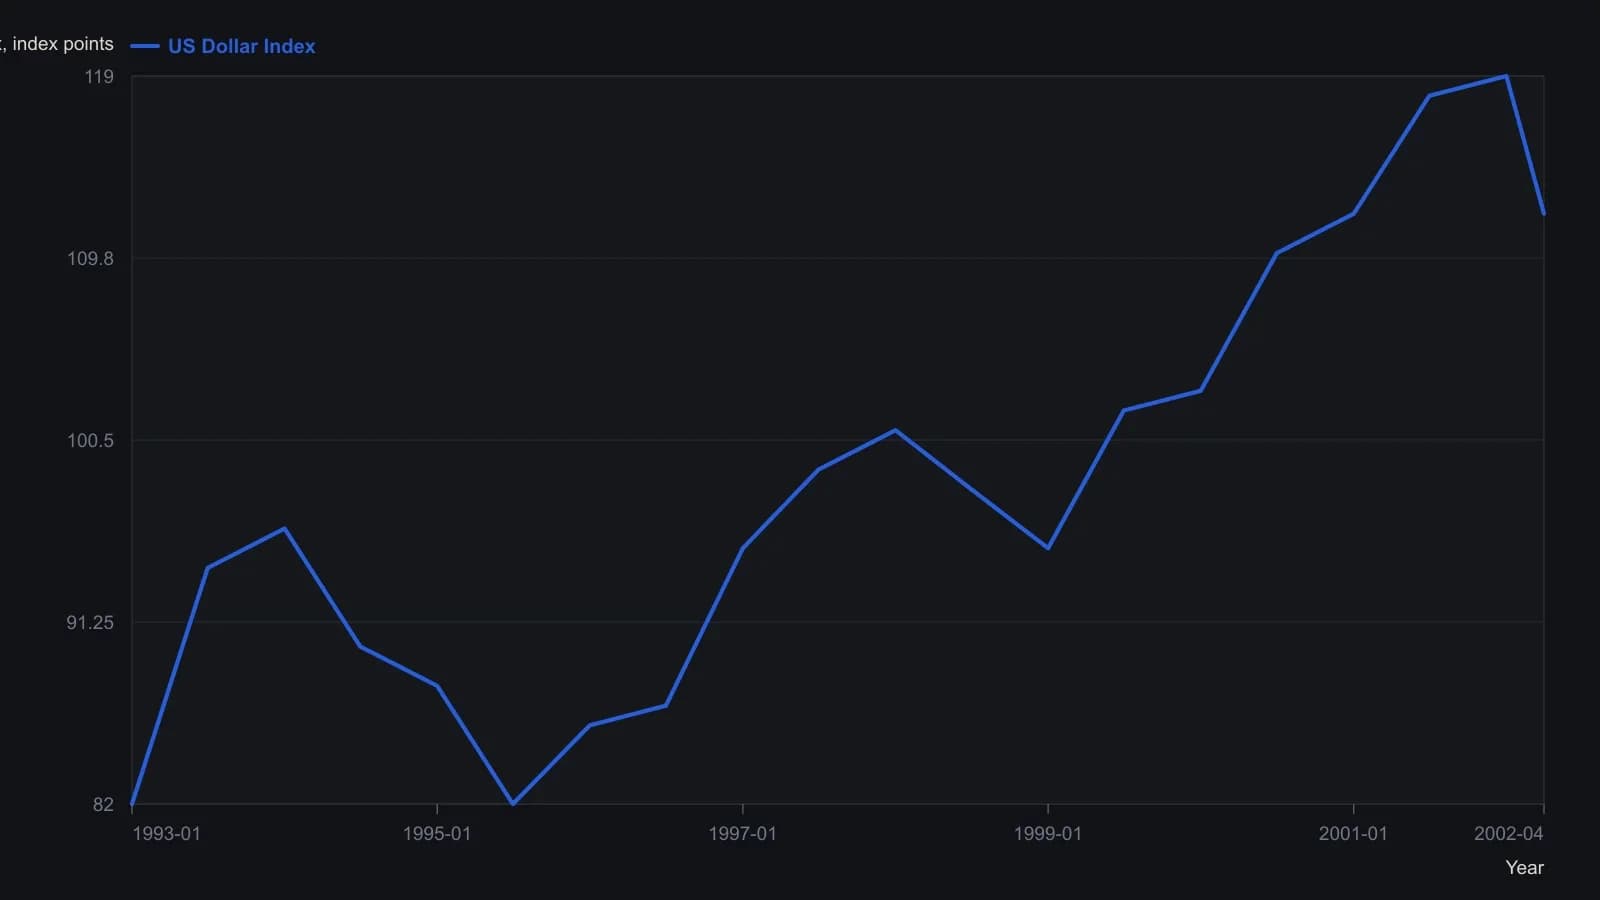
Values digitized from the plotted weekly line; about yearly samples, approximate to the printed grid.
All readings on this track · 34 readings
- 1984Range grid to sideways break in 1984 gold
- 1985When Gann lines, Gann angles, and a Fibonacci retracement coincide
- 1987Evaluating angular cycle overlays on independent stock swings
- 1988Multi-scale Elliott counts with Gann and Fibonacci confluence
- 1988Gann angles as hand-scaled chart geometry
- 1989A time, price, and pattern filter on one platinum sequence
- 1989Gann angles on point-and-figure grids
- 1990Gann price-time clusters for Elliott retracements
- 1990Channel regimes and Gann angle hinges
- 1990A gold campaign log as a trade procedure
- 1991A fourth Treasury bond resistance test as one time-price hypothesis
- 1991An eclipse calendar as a testable cycle scaffold
- 1992Gann-angle intersections and half-range zones
- 1998Wave and ratio self-similarity as a testable chart hypothesis
- 2000Constructing Gann fan angles from swing extremes
- 2002Combining Fibonacci retracement, Gann angles, and the moving average in FX
- 2002Halfway retracement as a trend confirmation filter
- 2006Volume distribution, Fibonacci extensions, and Gann angles on one downswing
- 2007Constructing Gann fans as currency support and resistance
- 2010ABC completion, wave-two windows, and Gann ratios
- 2010Constructing a Gann, Fibonacci, and decade-scale reversal cluster
- 2010Gann angles as timed tests that still need structure and RSI
- 2010Gann angles heritage is not a signal
- 2010Gann-fan time windows confirmed by Elliott-wave position
- 2010Gann angles as a repeatable chart hypothesis
- 2011Wave and ratio overlays as confirmation, not forecasts
- 2013Gold wave four as a time and price cluster check
- 2014A case study that separates cycle forecasts from Gann and Elliott readings
- 2014Relative charting, Gann angles, and trendline breakouts
- 2016Gann fans and a 2016 long-wave case as checkpoints, not forecasts
- 2017Gann angles, scale dependence, and the gap between legend and method
- 2017Gann angles as overlay, not original practice
- 2018Combine Gann angles, oscillator zones, and a protective stop
- 2020Confirming Gann hi-lo swings with ADX and stochastics