2000issue C111
Constructing Gann fan angles from swing extremes
Gann angles are built by joining one swing extreme to its opposite extreme, then projecting nine named geometric slopes from that origin. The 1x1 line at 45 degrees is treated as the primary trend line. The same measured slopes, applied across a span of price, produce the Gann fan used to identify broader-market bull and bear trends.
- Gann angles start by connecting a significant swing low to a significant swing high, or the reverse, then projecting fixed geometric slopes from that origin.
- The construction names nine slopes and treats the 1x1 line at 45 degrees as the primary trend line and bull-versus-bear divider.
- In an advance, the 1x1 line is intended as primary support, and a break of that line is read as a major trend reversal.
- Most named slopes come from an 8x8 square and its outer box. The 3x1 and 1x3 slopes use a different derivation.
Start from one swing pair
Gann angles are constructed by connecting a significant swing low to a significant swing high, or the reverse, then projecting a set of fixed geometric slopes from that origin. The chosen top or bottom is the swing extreme that anchors the whole construction.
A Gann fan is the family of geometric rays projected from that one significant high or low to map ranked trend lines through later price.
Fix the 1x1 line
The construction specifies nine named slopes and treats the 1x1 slope at 45 degrees as the primary trend line. The 1x1 line is that 45-degree Gann slope, used as the primary bull-versus-bear divider and as the intended support line in an advance.
Price above the 1x1 line is read as a bullish regime. Price below it is read as a bearish regime. In an advance, the 1x1 line is intended as primary support, and a break of that line is read as a major trend reversal.
Project the remaining slopes
An angle ratio is a Gann slope label that pairs units of price with units of time, such as 1x2 or 2x1. The nine construction slopes and their assigned degrees are 1x8 at 82.50, 1x4 at 75.00, 1x3 at 71.25, 1x2 at 63.75, 1x1 at 45.00, 2x1 at 26.25, 3x1 at 18.75, 4x1 at 15.00, and 8x1 at 7.50.
Most of those slopes are generated from the intersections of an 8x8 square and its outer box. The 3x1 and 1x3 slopes use a different derivation.
Applying the same measured slopes across a span of price produces the fan geometry used to identify broader-market bull and bear trends.
Nine Gann fan angles and their geometric degrees
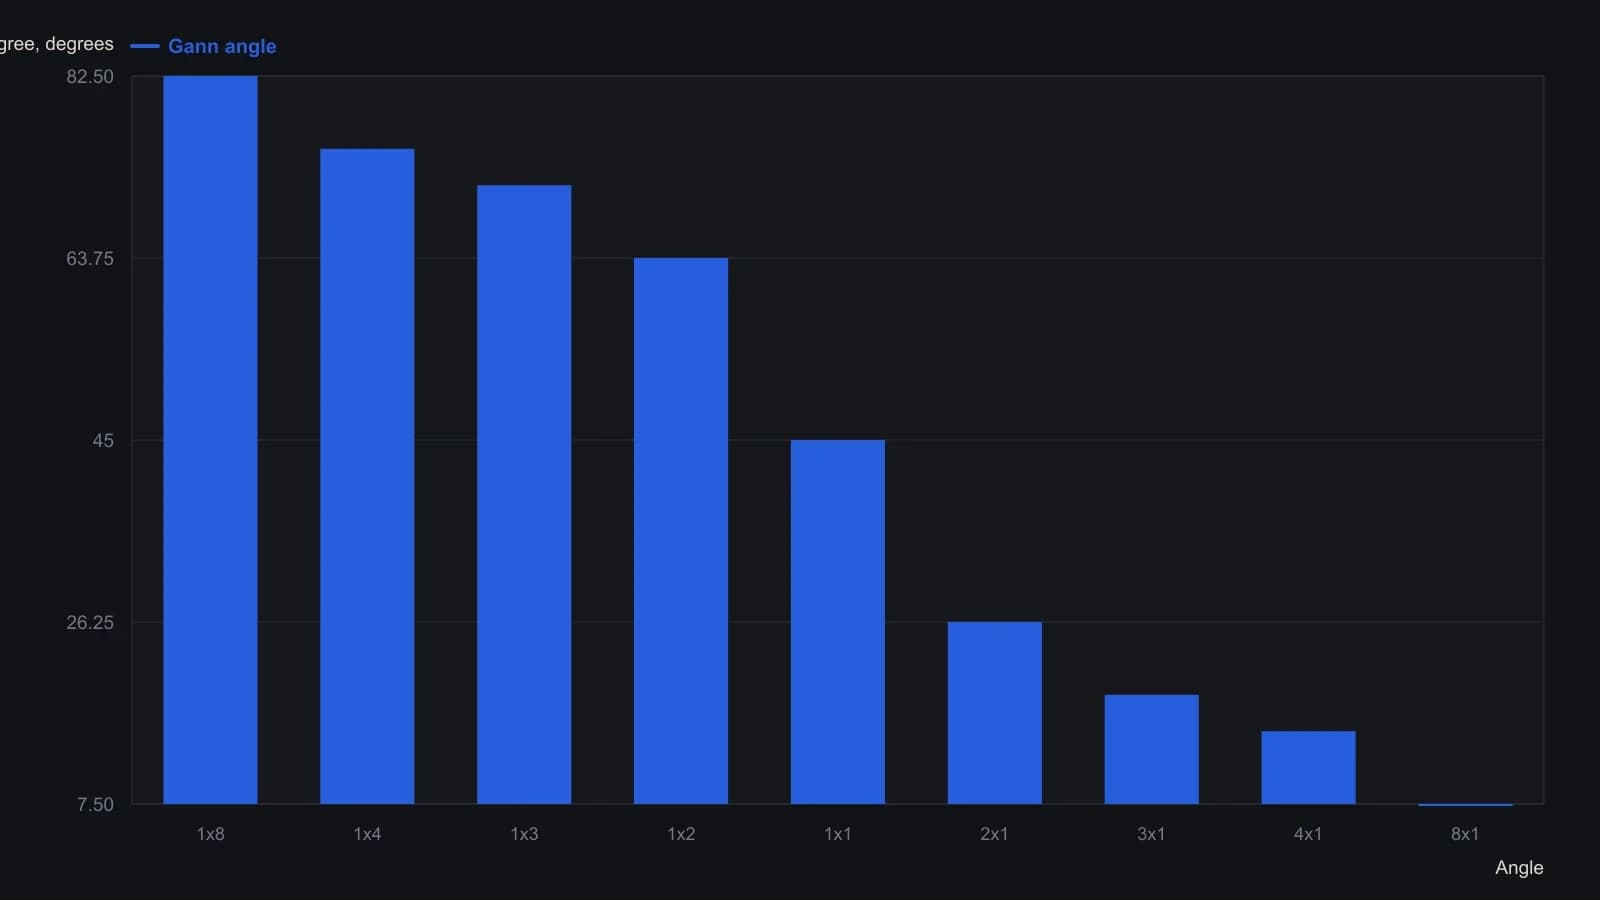
Most of these slopes are read from intersections on Gann’s 8-by-8 square; the 1x3 and 3x1 angles are constructed differently.
All readings on this track · 34 readings
- 1984Range grid to sideways break in 1984 gold
- 1985When Gann lines, Gann angles, and a Fibonacci retracement coincide
- 1987Evaluating angular cycle overlays on independent stock swings
- 1988Multi-scale Elliott counts with Gann and Fibonacci confluence
- 1988Gann angles as hand-scaled chart geometry
- 1989A time, price, and pattern filter on one platinum sequence
- 1989Gann angles on point-and-figure grids
- 1990Gann price-time clusters for Elliott retracements
- 1990Channel regimes and Gann angle hinges
- 1990A gold campaign log as a trade procedure
- 1991A fourth Treasury bond resistance test as one time-price hypothesis
- 1991An eclipse calendar as a testable cycle scaffold
- 1992Gann-angle intersections and half-range zones
- 1998Wave and ratio self-similarity as a testable chart hypothesis
- 2000Constructing Gann fan angles from swing extremes
- 2002Combining Fibonacci retracement, Gann angles, and the moving average in FX
- 2002Halfway retracement as a trend confirmation filter
- 2006Volume distribution, Fibonacci extensions, and Gann angles on one downswing
- 2007Constructing Gann fans as currency support and resistance
- 2010ABC completion, wave-two windows, and Gann ratios
- 2010Constructing a Gann, Fibonacci, and decade-scale reversal cluster
- 2010Gann angles as timed tests that still need structure and RSI
- 2010Gann angles heritage is not a signal
- 2010Gann-fan time windows confirmed by Elliott-wave position
- 2010Gann angles as a repeatable chart hypothesis
- 2011Wave and ratio overlays as confirmation, not forecasts
- 2013Gold wave four as a time and price cluster check
- 2014A case study that separates cycle forecasts from Gann and Elliott readings
- 2014Relative charting, Gann angles, and trendline breakouts
- 2016Gann fans and a 2016 long-wave case as checkpoints, not forecasts
- 2017Gann angles, scale dependence, and the gap between legend and method
- 2017Gann angles as overlay, not original practice
- 2018Combine Gann angles, oscillator zones, and a protective stop
- 2020Confirming Gann hi-lo swings with ADX and stochastics