2013issue C1010-15
Gold wave four as a time and price cluster check
A gold continuous futures monthly study treats wave four as the checkpoint for an unfinished impulse. Elliott wave analysis, a 144-bar Gann count, and Fibonacci retracement clusters are used together to decide whether a decline is a completed fourth wave or a pause inside wave three.
- Wave four is treated as the checkpoint that shows where an impulse is likely to end, before wave five is expected to terminate that pattern.
- On the gold monthly chart, wave three is labeled 2.146 times wave one, halted at 1923.7, and counted as 144 bars, a Gann square-of-12 period used to judge the later correction.
- A 15-bar pullback equal to 10.4% of that 144-bar scale is treated as incomplete because a classic time correction is required to reach at least 33.3%, or 48 bars.
- A break above 1923.7 before the May 2015 time window reclassifies the decline as a fourth subwave inside unfinished wave three, not a completed wave four.
Wave four as the impulse checkpoint
Wave-four development is treated as the checkpoint that reveals where a current impulsive pattern is likely to end, before wave five is expected to terminate that impulse.
On the gold continuous futures monthly chart, the historical workflow applies that checkpoint through Elliott wave analysis labels, Gann bar counts, and Fibonacci retracement clusters rather than through a single price swing.
The gold monthly setup
On the gold continuous futures monthly chart, a long wave two is described as storing kinetic energy that later appears as a strong, parabolic wave three.
Wave three is labeled as 2.146 times the size of wave one and is said to halt at the 1923.7 Fibonacci key level. The same wave-three advance is counted as 144 bars, identified as a Gann square-of-12 period that later supplies the time scale for judging wave-four retracement.
Price clusters from wave one
Multiple Fibonacci multiples of wave one are used as price clusters that coincide with internal wave-three and wave-four turning points: 0.618 at 734.1, 1.0 at 1031.5, 1.618 at 1512.6, and 2.146 at 1923.7.
Gold W(3) and W(4) Fibonacci price clusters
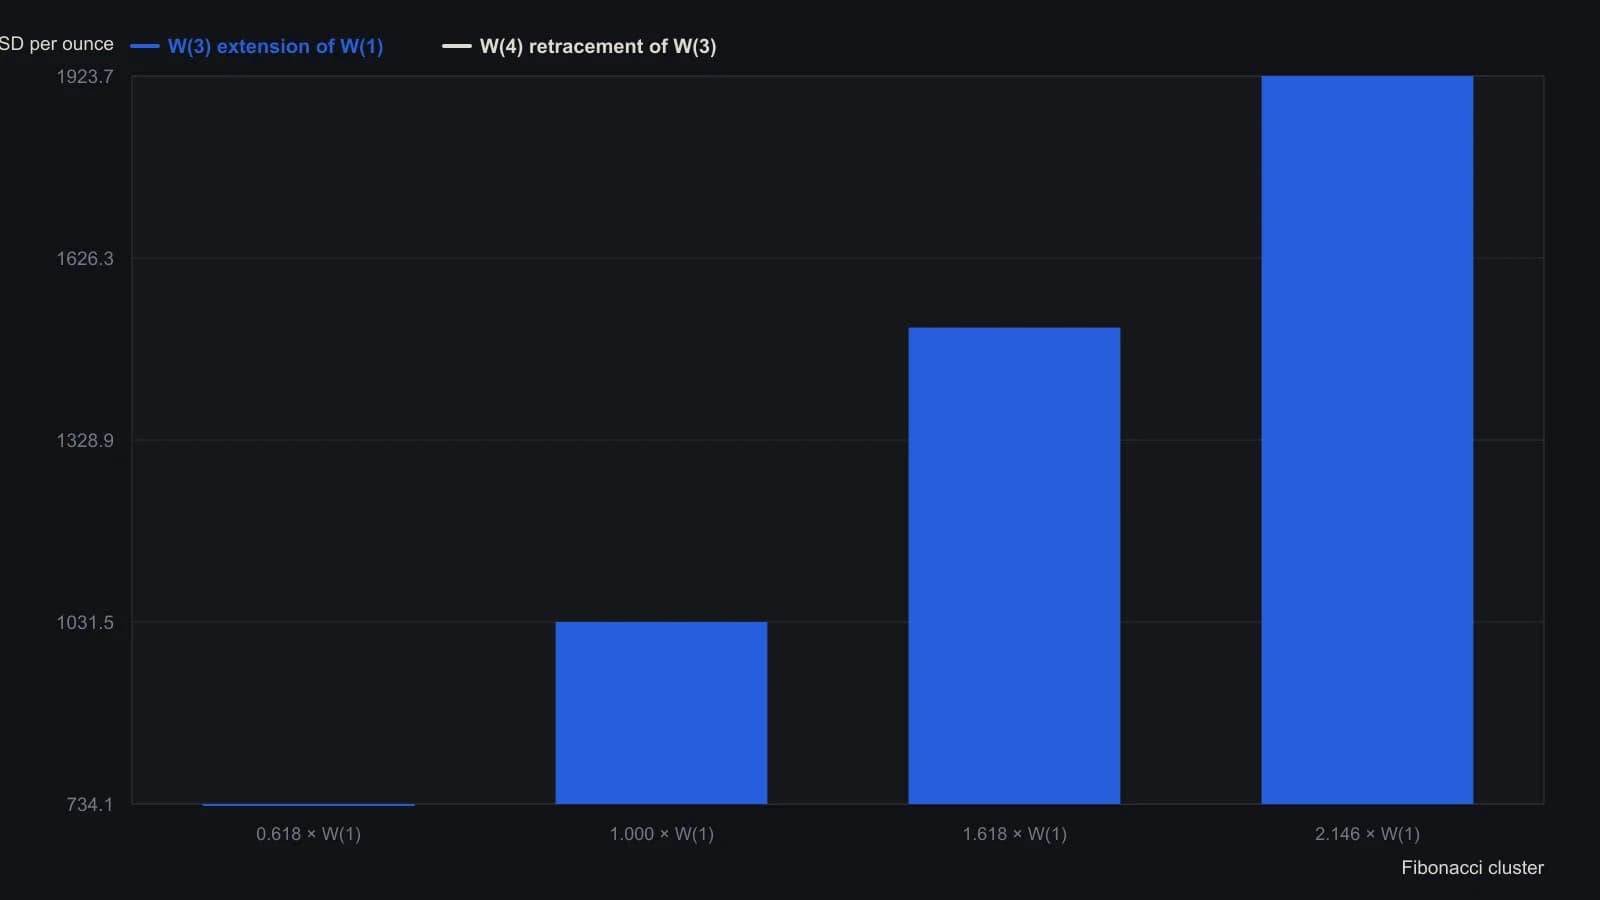
W(3) lasted the 144-bar Gann square from 1 September 1999 to 1 September 2011. As of 10 December 2012 the OSC(5,35) reading still sat outside the 0.90–1.40 W(4) zone, so the deeper retracement clusters were still untested.
Alternation and the time test
Alternation is applied so a 236-bar, 81.2% wave two implies a shorter-lasting but not necessarily shallow wave four, while the strong wave three still argues for a deeper-than-classic 38.2% price retracement.
A 15-bar wave four, only 10.4% of the 144-bar wave-three scale, is treated as incomplete because a classic time correction is required to reach at least 33.3%, or 48 bars.
When the third wave stays open
If price breaks above 1923.7 before the May 2015 time window, the current decline is reclassified as a fourth subwave inside an unfinished wave three rather than a completed wave four.
Pathway lines for the correction
Gann angles drawn from the high are used as successive pathway lines for the unfolding correction: TL-5 to the 33.3% time location, a 1x2 TL-3 to the 50% location, and a 1x1 TL-4 to the 100% location of the 236-bar scale.
Price landmarks for the correction include Fibonacci retracements at 23.6%, 38.2%, 50%, and 61.8%, corresponding to 1529.4, 1285.4, 1088.3, and 891.2, plus an 873.0 delimiting level.
All readings on this track · 34 readings
- 1984Range grid to sideways break in 1984 gold
- 1985When Gann lines, Gann angles, and a Fibonacci retracement coincide
- 1987Evaluating angular cycle overlays on independent stock swings
- 1988Multi-scale Elliott counts with Gann and Fibonacci confluence
- 1988Gann angles as hand-scaled chart geometry
- 1989A time, price, and pattern filter on one platinum sequence
- 1989Gann angles on point-and-figure grids
- 1990Gann price-time clusters for Elliott retracements
- 1990Channel regimes and Gann angle hinges
- 1990A gold campaign log as a trade procedure
- 1991A fourth Treasury bond resistance test as one time-price hypothesis
- 1991An eclipse calendar as a testable cycle scaffold
- 1992Gann-angle intersections and half-range zones
- 1998Wave and ratio self-similarity as a testable chart hypothesis
- 2000Constructing Gann fan angles from swing extremes
- 2002Combining Fibonacci retracement, Gann angles, and the moving average in FX
- 2002Halfway retracement as a trend confirmation filter
- 2006Volume distribution, Fibonacci extensions, and Gann angles on one downswing
- 2007Constructing Gann fans as currency support and resistance
- 2010ABC completion, wave-two windows, and Gann ratios
- 2010Constructing a Gann, Fibonacci, and decade-scale reversal cluster
- 2010Gann angles as timed tests that still need structure and RSI
- 2010Gann angles heritage is not a signal
- 2010Gann-fan time windows confirmed by Elliott-wave position
- 2010Gann angles as a repeatable chart hypothesis
- 2011Wave and ratio overlays as confirmation, not forecasts
- 2013Gold wave four as a time and price cluster check
- 2014A case study that separates cycle forecasts from Gann and Elliott readings
- 2014Relative charting, Gann angles, and trendline breakouts
- 2016Gann fans and a 2016 long-wave case as checkpoints, not forecasts
- 2017Gann angles, scale dependence, and the gap between legend and method
- 2017Gann angles as overlay, not original practice
- 2018Combine Gann angles, oscillator zones, and a protective stop
- 2020Confirming Gann hi-lo swings with ADX and stochastics