2014issue C1026-31
Relative charting, Gann angles, and trendline breakouts
A 1x1 angle is only meaningful after you choose whether geometry is anchored to a fixed price-per-bar unit or to a named uptrend-vector. This article uses a monthly S&P 500 workflow to contrast an autosize-ratio with a chosen gann-1x1, then with relative-charting, and to require both alignments before a channel breakout is called.
- An autosize-ratio is geometrically meaningless because it depends only on how much history happens to be on screen.
- A gann-1x1 is the 45-degree line created after you choose a price-per-period unit; on the monthly S&P 500 example that unit is 10 points per month.
- Relative-charting scales the vertical axis so a named uptrend-vector becomes the 1x1, and later angles and channels are measured against that trend.
- Combinational-analysis treats a Gann-scaled chart and a relative-scaled chart as complementary: an upshift or breakout on one alignment is only a candidate if the other shows a compatible reaction.
Chart geometry is not self-proving. The same monthly S&P 500 history can produce different angles, different time counts, and different channel edges once the vertical scale changes.
Editorial: TradersWeek treats scale as an explicit hypothesis. A 1x1 angle is only meaningful after you choose whether geometry is anchored to a fixed price-per-bar unit or to a named trend vector. The same structure should confirm or fail on both alignments before a channel breakout is called.
Autosize is not a scale hypothesis
A charting program's autosize fit of a monthly S&P 500 history produced 10.86 points per month and an uptrend-vector reading of 51.10 degrees. That autosize-ratio is treated as geometrically meaningless because it depends only on how much history happens to be on screen.
The gann-1x1 needs a chosen price unit
Traditional Gann alignment uses a predetermined price-per-period unit so that one price unit equals one time unit at 45 degrees. That line is the gann-1x1. On the monthly S&P 500 example the chosen unit is 10 points per month rather than 1 point per month because the latter is impractical at that price level.
After aligning the same monthly S&P 500 chart to 10 points per month, the 10/M line is the 45-degree gann-1x1 and the uptrend-vector reads 53.45 degrees. That gann-1x1 is described as cutting the 90-degree price-time square in half and as marking support and resistance at two labeled points.
A degree reading can be reread as a time count
On the 10/M Gann alignment, a double-candle reversal is located at months 53 and 54 after the uptrend high, in March and April 2012, matching the 53.45-degree vector reading. Counting 51.10 months from the same high using the autosize angle does not mark a top or bottom.
Time-angle-echo is the idea that the degree reading of a trend vector on a properly scaled Gann chart can be reread as a count of bars or months from a pivot, producing a dated window where a reversal is hypothesized. The aligned 53.45-degree reading supplied that window. The autosize 51.10-degree reading did not.
Relative-charting makes the named trend the 1x1
Relative-charting inverts the Gann convention. It first converts a named uptrend into a price-versus-time ratio and then changes the vertical scale so that same vector becomes the 1x1. In the example, the October 2002 to October 2007 rise from 768.63 to 1,576.09 is set to exactly 45 degrees, and all later geometry is measured from it.
An uptrend-vector is a straight line from a defined swing low to a defined swing high. Under Gann alignment it is compared with a fixed gann-1x1. Under relative-charting it becomes the 1x1, and later angles, channels, and shapes are measured against that trend rather than against a fixed price-per-period unit.
The same wedge does not reprint on both scales
On the monthly S&P 500 relative chart, a circle construction is used both to link six historical points retrospectively and to enclose the later large uptrend as a rising wedge whose four interior points are being tested.
That enclosure is the rising-wedge-test. A close through the enclosure is a candidate breakout. A reversal that merely shifts higher along the same lines is not.
The same rising-wedge outline on a Gann-scaled chart does not reproduce the exact highs and lows of the relative chart. Price is described as reacting with an upward shift, so a later monthly close is required to distinguish a genuine breakout from another upshifted reversal along the enclosing lines.
A parallel of the uptrend-vector, when anchored at the circle bottom on the relative chart and then moved to a new source near 567, is presented as valid support for two lesser lows.
S&P 500 monthly with the 2002–2007 rise set as 1x1
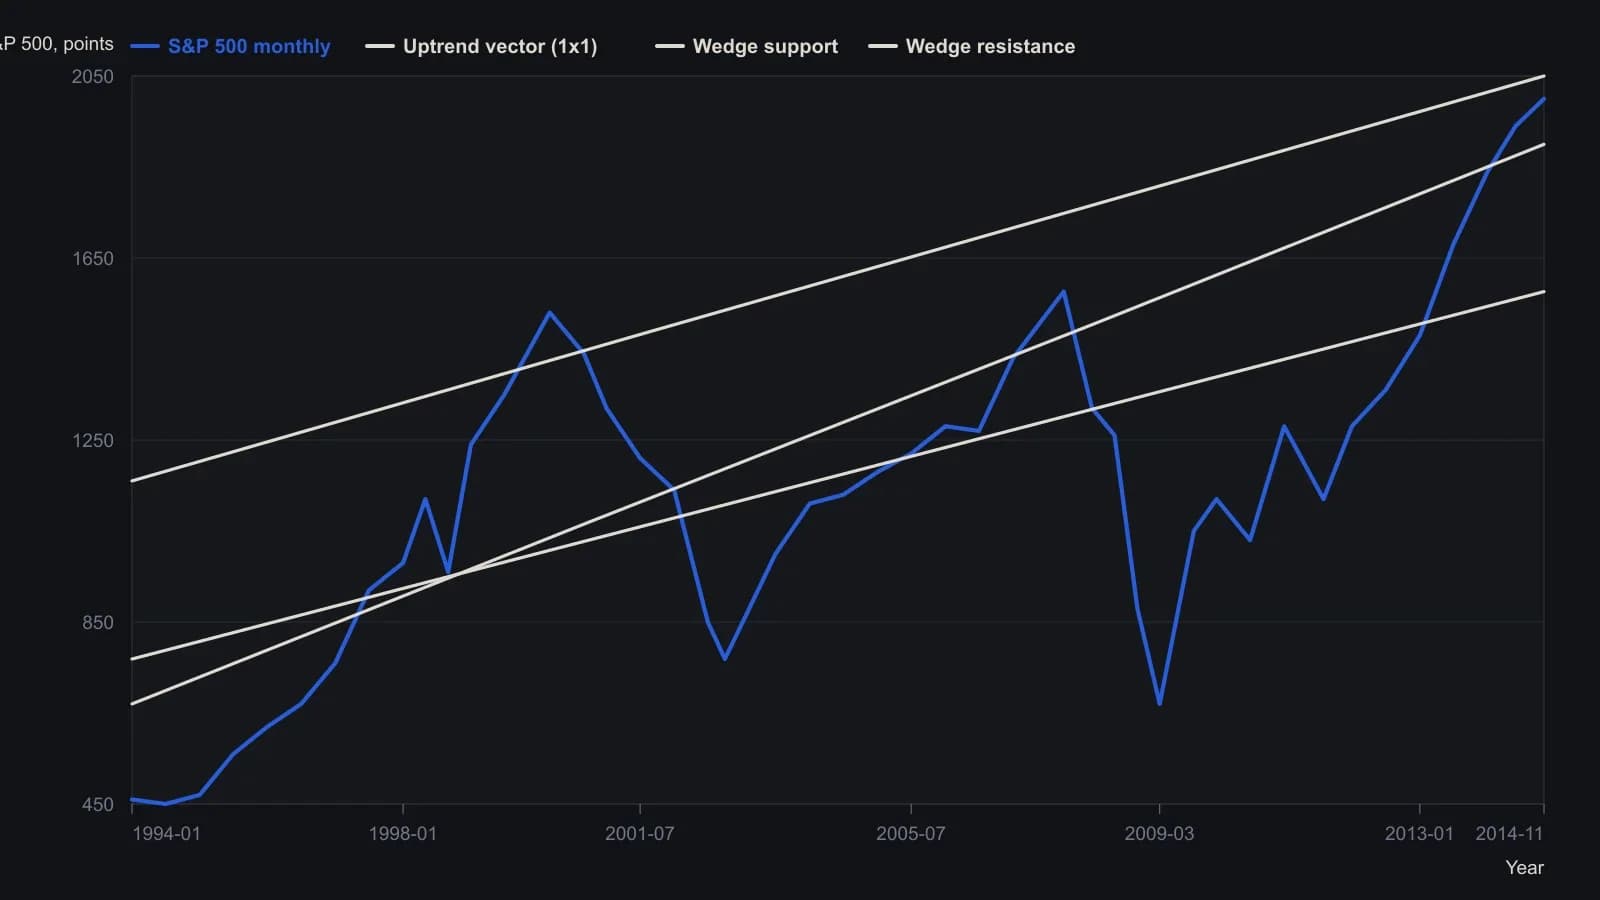
Vertical scale is the article’s relative-charting ratio of 13.4577 points per month so the named uptrend prints at 45 degrees. Except for those two labeled prints, prices are approximate raster readings (nearest 10 points). Intermediate points on the uptrend vector are the straight line implied by 807.46 points over 60 months.
Combinational-analysis requires a compatible reaction
Combinational-analysis treats the two geometries as complementary rather than mutually exclusive. A bullish upshift and a possible push toward the prior all-time high on the Gann chart is used as supporting context for a wedge breakout hypothesis on the relative chart, and the reverse reading is used the other way.
Editorial: TradersWeek does not treat either alignment as a completed signal on its own. An upshift or breakout on one alignment is only treated as actionable if the other alignment shows a compatible reaction.
All readings on this track · 34 readings
- 1984Range grid to sideways break in 1984 gold
- 1985When Gann lines, Gann angles, and a Fibonacci retracement coincide
- 1987Evaluating angular cycle overlays on independent stock swings
- 1988Multi-scale Elliott counts with Gann and Fibonacci confluence
- 1988Gann angles as hand-scaled chart geometry
- 1989A time, price, and pattern filter on one platinum sequence
- 1989Gann angles on point-and-figure grids
- 1990Gann price-time clusters for Elliott retracements
- 1990Channel regimes and Gann angle hinges
- 1990A gold campaign log as a trade procedure
- 1991A fourth Treasury bond resistance test as one time-price hypothesis
- 1991An eclipse calendar as a testable cycle scaffold
- 1992Gann-angle intersections and half-range zones
- 1998Wave and ratio self-similarity as a testable chart hypothesis
- 2000Constructing Gann fan angles from swing extremes
- 2002Combining Fibonacci retracement, Gann angles, and the moving average in FX
- 2002Halfway retracement as a trend confirmation filter
- 2006Volume distribution, Fibonacci extensions, and Gann angles on one downswing
- 2007Constructing Gann fans as currency support and resistance
- 2010ABC completion, wave-two windows, and Gann ratios
- 2010Constructing a Gann, Fibonacci, and decade-scale reversal cluster
- 2010Gann angles as timed tests that still need structure and RSI
- 2010Gann angles heritage is not a signal
- 2010Gann-fan time windows confirmed by Elliott-wave position
- 2010Gann angles as a repeatable chart hypothesis
- 2011Wave and ratio overlays as confirmation, not forecasts
- 2013Gold wave four as a time and price cluster check
- 2014A case study that separates cycle forecasts from Gann and Elliott readings
- 2014Relative charting, Gann angles, and trendline breakouts
- 2016Gann fans and a 2016 long-wave case as checkpoints, not forecasts
- 2017Gann angles, scale dependence, and the gap between legend and method
- 2017Gann angles as overlay, not original practice
- 2018Combine Gann angles, oscillator zones, and a protective stop
- 2020Confirming Gann hi-lo swings with ADX and stochastics