1990issue C081-9
Channel regimes and Gann angle hinges
A price channel is treated as the current linear regime of repeated swings. Gann angles mark chart-scale hinges where that regime can lose authority, and a coil, gap, or sharp break at the hinge is the test for whether new boundaries must be drawn.
- A price channel is a pair of boundaries that contain repeated swings and stand as the current linear regime of price versus time.
- Gann angles are geometric rays taken from chart scale to mark candidate hinges where that regime may hold, fail, or give way to a new set of boundaries.
- Inside one domain the next motion can be projected from the current relationship, but at a domain boundary that same relationship no longer decides the outcome.
- TradersWeek editorial reading: the working test is not that the old channel must continue, but whether a coil, gap, or sharp break at the hinge forces new boundaries to be drawn.
Channels as the current linear regime
Stocks and commodities are described as repeatedly traveling in upward and downward price channels and oscillating from one channel boundary to the other while remaining inside that structure. Nested rallies and declines are described as forming straight inner channels that zigzag between the boundaries of a larger outer channel.
In this usage, a price channel is a pair of boundaries that contain those repeated swings and are treated as the current linear regime of price versus time. A linear regime is a stretch in which the response of price to the passage of time stays proportional and can be sketched with straight channel lines.
Price can also change at an increasing rate and trace a curve rather than a straight line. That stretch is nonlinear acceleration. A linear scale is said to display the channel mode more clearly, while a logarithmic scale is said to display the curved mode more clearly.
Geometric order and more than one rest state
Market order of the geometric kind associated with Gann angles is presented as real but imperfect, because price is said to follow the physical behavior of a chaotic system rather than one unbroken linear rule. A linear system is described as having a single rest state, while a nonlinear system can have more than one rest state and, when it does, is treated as chaotic.
Inside one domain of behavior the next motion can be projected from the current relationship, but at the boundary between domains that same relationship no longer decides the outcome. A domain boundary is the meeting of two incompatible price relationships. A simple rule may apply inside one domain but does not cover both sides of the boundary.
The hinge at a domain boundary
At the meeting of two behavioral domains, prices are described as either coiling in a triangle, often of five waves, or shifting rapidly into a new region, often with a gap that means prior channel boundaries need not still apply. A gap is an abrupt price jump read as evidence that a new relationship now governs and that prior channel lines need not still bind.
The unstable balance between two domains of behavior is a strange attractor, where a small push can send price back into the old regime or into a new one. Gann angles are geometric rays taken from chart scale to mark candidate hinges where an existing channel regime may hold, fail, or give way to a new set of boundaries.
Index cases from the late 1980s
After the 1987 break, a major U.S. industrial average is described as staying inside marked channel lines through 1988, then breaking the top of that channel at a precomputed hinge in early 1989. Newly drawn channel boundaries are then said to have held until a sharp break in October 1989.
After the October 1989 break, two nearly overlapping nonlinear boundary regions were computed on a broad U.S. equity index, with a high in late December or early January. Price is described as reaching that hinge and then falling sharply in a January selloff.
A rising growth-boundary curve on a major Japanese equity average is described as ending in December 1989, with a labeled high of 37233 on December 27, 1989, after which price turned down from a linear channel top on December 29.
S&P 500 coil into the 1989–90 attractor
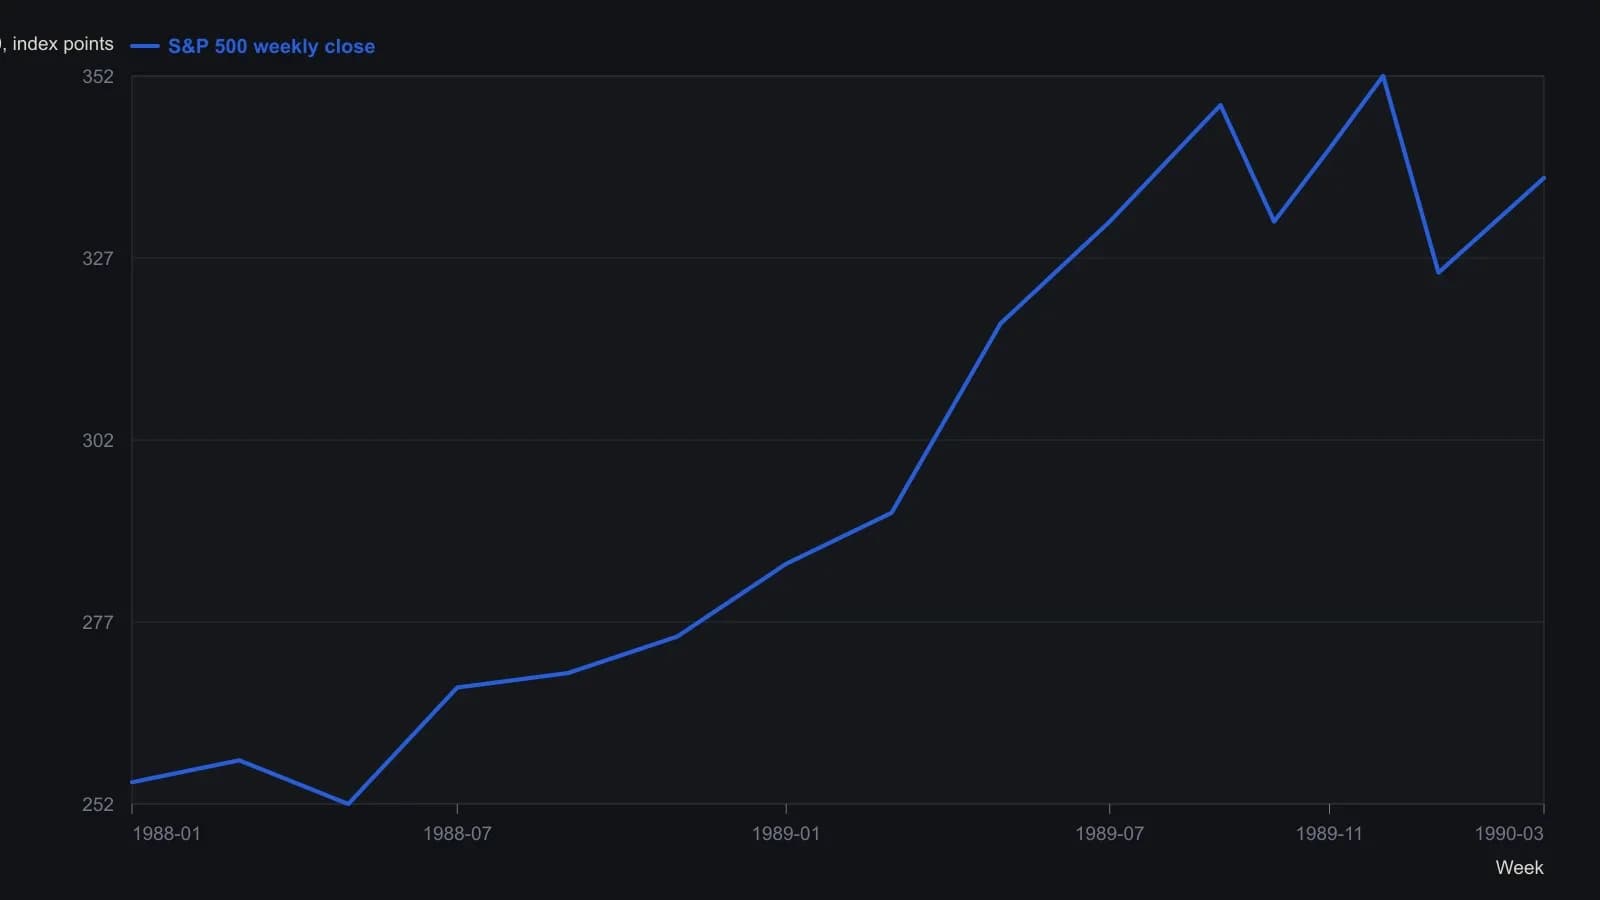
Weekly highs and lows were digitized from the raster; y-values are approximate to about 5 index points. The source also states a late-December or early-January high as the computed attractor.
All readings on this track · 34 readings
- 1984Range grid to sideways break in 1984 gold
- 1985When Gann lines, Gann angles, and a Fibonacci retracement coincide
- 1987Evaluating angular cycle overlays on independent stock swings
- 1988Multi-scale Elliott counts with Gann and Fibonacci confluence
- 1988Gann angles as hand-scaled chart geometry
- 1989A time, price, and pattern filter on one platinum sequence
- 1989Gann angles on point-and-figure grids
- 1990Gann price-time clusters for Elliott retracements
- 1990Channel regimes and Gann angle hinges
- 1990A gold campaign log as a trade procedure
- 1991A fourth Treasury bond resistance test as one time-price hypothesis
- 1991An eclipse calendar as a testable cycle scaffold
- 1992Gann-angle intersections and half-range zones
- 1998Wave and ratio self-similarity as a testable chart hypothesis
- 2000Constructing Gann fan angles from swing extremes
- 2002Combining Fibonacci retracement, Gann angles, and the moving average in FX
- 2002Halfway retracement as a trend confirmation filter
- 2006Volume distribution, Fibonacci extensions, and Gann angles on one downswing
- 2007Constructing Gann fans as currency support and resistance
- 2010ABC completion, wave-two windows, and Gann ratios
- 2010Constructing a Gann, Fibonacci, and decade-scale reversal cluster
- 2010Gann angles as timed tests that still need structure and RSI
- 2010Gann angles heritage is not a signal
- 2010Gann-fan time windows confirmed by Elliott-wave position
- 2010Gann angles as a repeatable chart hypothesis
- 2011Wave and ratio overlays as confirmation, not forecasts
- 2013Gold wave four as a time and price cluster check
- 2014A case study that separates cycle forecasts from Gann and Elliott readings
- 2014Relative charting, Gann angles, and trendline breakouts
- 2016Gann fans and a 2016 long-wave case as checkpoints, not forecasts
- 2017Gann angles, scale dependence, and the gap between legend and method
- 2017Gann angles as overlay, not original practice
- 2018Combine Gann angles, oscillator zones, and a protective stop
- 2020Confirming Gann hi-lo swings with ADX and stochastics