1990issue C091-10
A gold campaign log as a trade procedure
A daily market log recorded a 30-to-90-day gold campaign as a written Pre-trade checklist: the position, the next time and price zones, and the exact conditions to enter, add, adjust a stop, or exit.
- The daily log recorded the position, upcoming time and price zones, news that may affect price, and the exact conditions required to enter, add, adjust a stop, or exit.
- A low-risk setup was defined only when time analysis, a nearby price objective, and short- and longer-term pattern all indicated that change was likely.
- Later price action could reverse a new-high read, authorize added shorts after confirmation, or flatten the position when a 62 percent bounce hit the protective stop.
- The same written procedure accepted a planned first-attempt loss and required the trader to stay flat when travel would break the decision process.
A campaign written as a checklist
A daily market log recorded the position, upcoming time and price zones, news that may affect price, and the exact conditions required to enter, add, adjust a stop, or exit.
The written campaign sought 30-to-90-day positions, with more than one planned chance to enter or add as a move developed.
TradersWeek editorial reading: the log is a Pre-trade checklist for one gold hypothesis. The setup is written first. Later price action is then used only to confirm, cancel, or add to that same plan.
Confluence defined the only low-risk setup
A low-risk setup was defined only when time analysis, a nearby price objective, and short- and longer-term pattern all indicated that change was likely.
Projected turning-point periods lasted a week or less. They came from overlapping time-cycle ratios, time counts, and price-square-time factors.
Gann angles supplied the nearby support map. January 3 support was read as a 1x1 angle cluster plus a 50 percent retracement of the prior advance. January 22 was treated as a turning-point low at a 62 percent retracement and 1x1 support.
TradersWeek editorial reading: Elliott wave analysis belongs in the pattern slot of that same test, as short- and longer-term structure, not as a second system running beside the checklist.
Price action confirmed, canceled, or added
A wide-range close near the low at the November high was treated as failed buying power and a possible triple top, reversing the earlier new-high hypothesis.
Shorts were added only after reversal-day and gap-down confirmation, then flattened when a 62 percent bounce of the minor decline hit the protective stop.
A fourth test of the same high was treated as a decision point. Failure implied a countermove. A close above the cluster implied continuation.
April 1990 gold campaign prices from the daily log
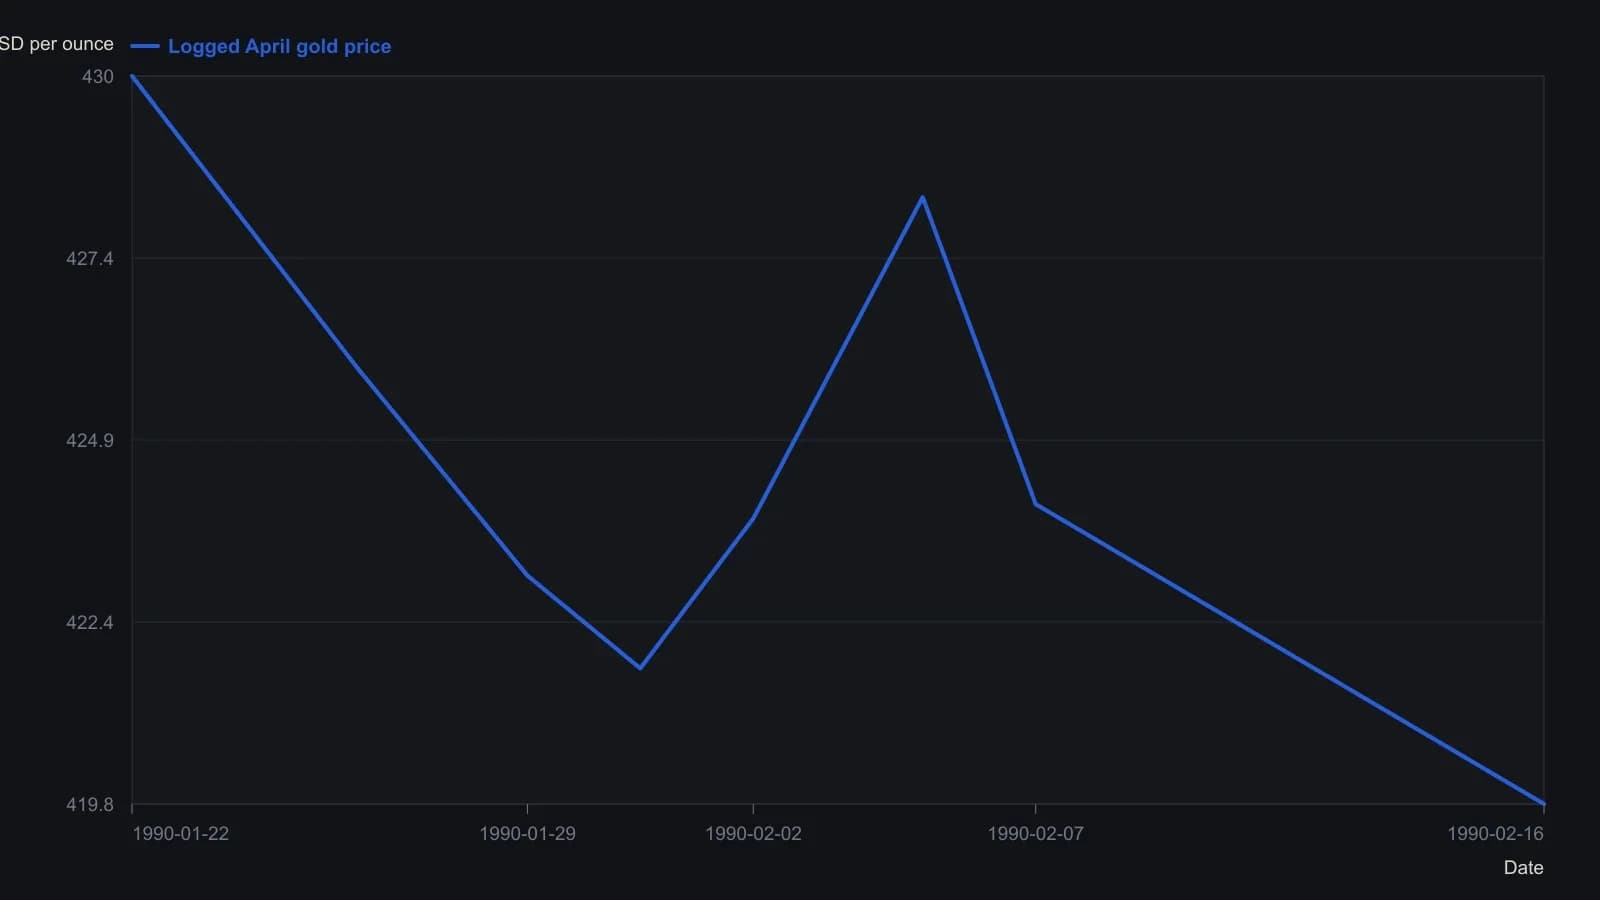
The log is truncated after February 20; only prices the article states in dollars per ounce are plotted. Protective stops and option premiums are omitted so the series stays on the futures price.
Review, planned losses, and standing aside
After an $800 first-attempt loss, later confirmed shorts and a put sale were closed for a campaign net of $6,550 before the trader stood aside while traveling.
The log was used to review why each action was taken, accept planned losses, and stay flat when travel would break the same decision procedure.
All readings on this track · 34 readings
- 1984Range grid to sideways break in 1984 gold
- 1985When Gann lines, Gann angles, and a Fibonacci retracement coincide
- 1987Evaluating angular cycle overlays on independent stock swings
- 1988Multi-scale Elliott counts with Gann and Fibonacci confluence
- 1988Gann angles as hand-scaled chart geometry
- 1989A time, price, and pattern filter on one platinum sequence
- 1989Gann angles on point-and-figure grids
- 1990Gann price-time clusters for Elliott retracements
- 1990Channel regimes and Gann angle hinges
- 1990A gold campaign log as a trade procedure
- 1991A fourth Treasury bond resistance test as one time-price hypothesis
- 1991An eclipse calendar as a testable cycle scaffold
- 1992Gann-angle intersections and half-range zones
- 1998Wave and ratio self-similarity as a testable chart hypothesis
- 2000Constructing Gann fan angles from swing extremes
- 2002Combining Fibonacci retracement, Gann angles, and the moving average in FX
- 2002Halfway retracement as a trend confirmation filter
- 2006Volume distribution, Fibonacci extensions, and Gann angles on one downswing
- 2007Constructing Gann fans as currency support and resistance
- 2010ABC completion, wave-two windows, and Gann ratios
- 2010Constructing a Gann, Fibonacci, and decade-scale reversal cluster
- 2010Gann angles as timed tests that still need structure and RSI
- 2010Gann angles heritage is not a signal
- 2010Gann-fan time windows confirmed by Elliott-wave position
- 2010Gann angles as a repeatable chart hypothesis
- 2011Wave and ratio overlays as confirmation, not forecasts
- 2013Gold wave four as a time and price cluster check
- 2014A case study that separates cycle forecasts from Gann and Elliott readings
- 2014Relative charting, Gann angles, and trendline breakouts
- 2016Gann fans and a 2016 long-wave case as checkpoints, not forecasts
- 2017Gann angles, scale dependence, and the gap between legend and method
- 2017Gann angles as overlay, not original practice
- 2018Combine Gann angles, oscillator zones, and a protective stop
- 2020Confirming Gann hi-lo swings with ADX and stochastics