1989issue C051-7
A time, price, and pattern filter on one platinum sequence
This case treats a platinum reversal day as a testable hypothesis only when a finishing Elliott fifth wave, a clustered change-in-trend window, and a pre-mapped price band occur together. Later Fibonacci retracements, Gann angles, and measured-wave targets then test whether that time-price-pattern coincidence still holds.
- The notes treated an entry or exit as complete only when a finished price pattern, a time window associated with a possible trend change, and a notable price level occurred together.
- A 26 September reversal-day low at 481.50 completed an Elliott fifth wave inside a 472-486 support band and a mid-to-late September time cluster.
- The timing combined a 61.8 percent Fibonacci time ratio with Gann-style counts, including a 49-day death zone, around 16 September and 24 to 27 September.
- After the low, rally marks, Gann angles, C-wave projections, and fifth-wave Fibonacci equalities were used to keep or drop the working hypothesis.
What counted as a complete setup
The notes treated an entry or exit as complete only when a finished price pattern, a time window associated with a possible trend change, and a notable price level occurred together.
In the terms used here, that is a time-price-pattern coincidence. A setup is treated as complete only when a finished wave form, a clustered time window, and a pre-mapped price band occur together.
How the September time cluster was built
A 61.8 percent Fibonacci time ratio applied to a 171-calendar-day gold swing produced a 106-day projection that landed on 16 September from the 2 June high.
Separate Gann-style counts of 30 weeks from a 29 February low, 30 calendar days from a 25 August high, and 49 calendar days from a 9 August low clustered additional change-in-trend dates around 24 to 27 September. The 49-calendar-day count is the death zone in this workflow: a Gann 49-period time count treated as one more date to cluster with the other timing marks.
The price band and the Elliott fifth wave
From the June high, platinum was read as a fifth or final Elliott wave. The general form and ratio of that Elliott fifth wave were treated as more important than a strict textbook count.
Prior declines of 89, 90, and 76 points, subtracted from the 25 August high at 562, defined a 472-486 termination band. The notes recorded 89 as a Fibonacci number and 90 as a Gann number.
When the three conditions met
A 26 September reversal-day low at 481.50 completed the fifth-wave form inside that support band and inside the mid-to-late September time cluster. The session followed a 19 September gap read as an exhaustion gap and a 23 September outside down day.
The exhaustion gap was treated as a possible last thrust rather than a continuation break because it appeared inside a finishing wave and a support band. The reversal day is used only as short-term confirmation after time, price, and pattern already coincide.
Platinum swing prices from the June 1988 high to the December reversal
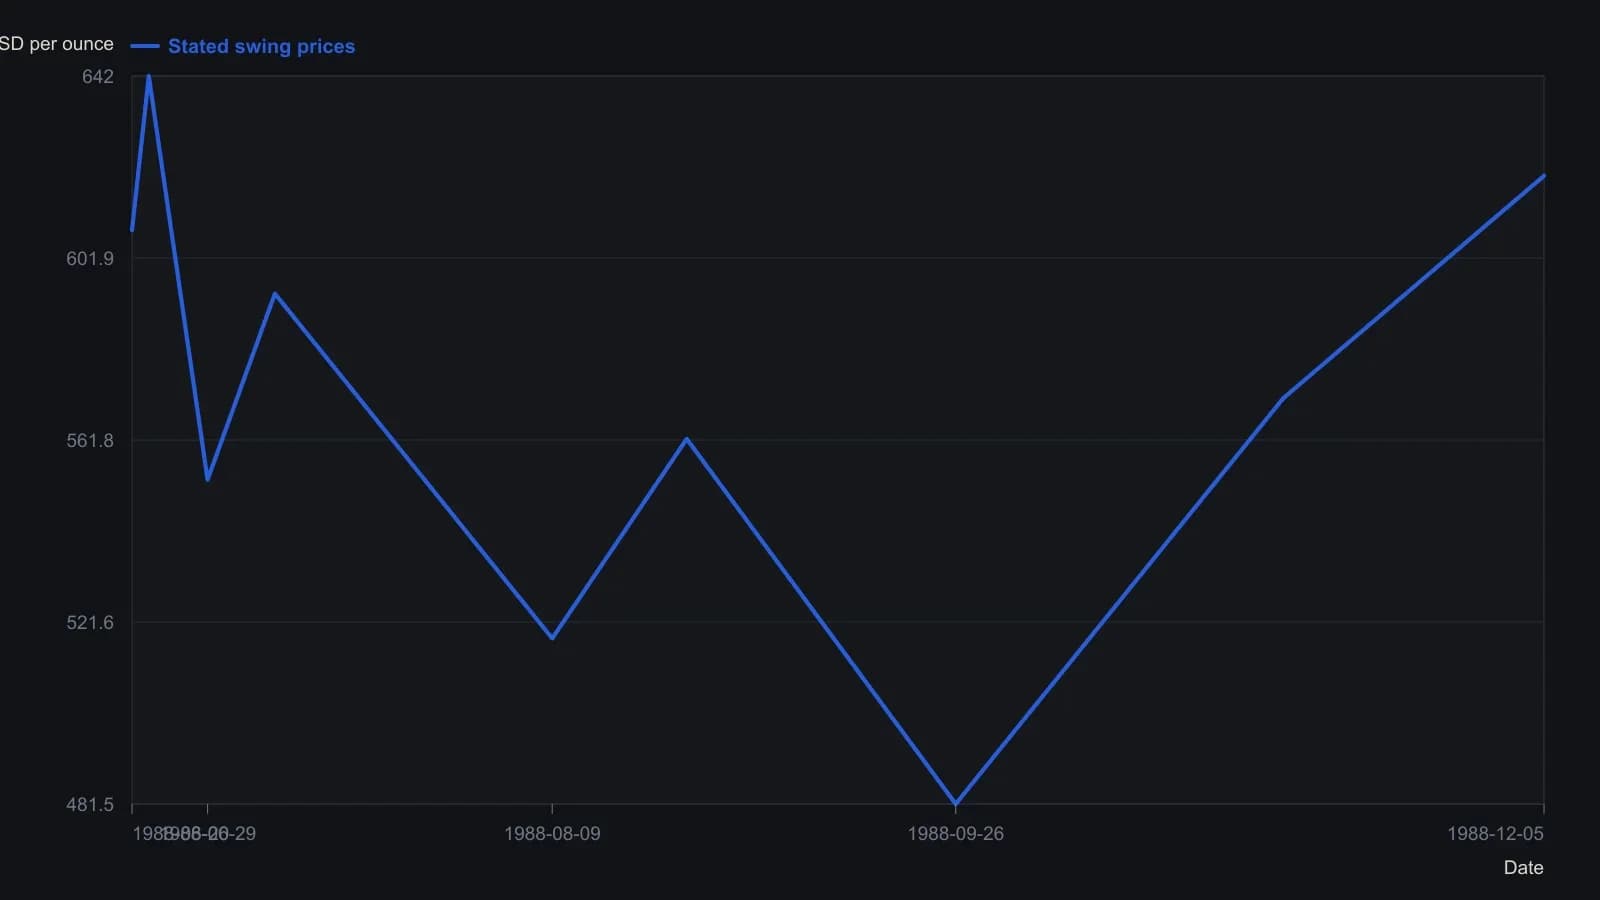
The $544 A-wave top and $523 B-wave low are stated without calendar dates and are omitted so no dates are invented. November 3 is described only as a reversal above $586, so that high is omitted as well.
Rally marks and Gann angles after the low
The 80.50-point swing from 562 to 481.50 implied 38 percent and 50 percent rally marks at 512 and 522. Fibonacci retracements of 38 percent and 50 percent of the longer June-to-September decline implied 542 and 562.
A high at 544, two points above the 38 percent mark of the June-to-September decline, coincided with the 1x1 Gann angle from the June high. A Gann angle is a geometric support or resistance line drawn from a swing at a fixed rise-to-run ratio. Trailing risk was set to the lower of a 62 percent pullback from the 26 September low or the 1x2 Gann angle from that low.
Later measured-wave targets
A C-wave equal to 61.8 percent of the A-wave, added to the B-wave low at 523, projected 562. A C-wave equal to the A-wave projected 586, near a 62 percent retracement of the June-to-September cycle at 581. A later reversal day occurred as price met the 2x1 Gann angle from the June high.
Fifth-wave Fibonacci equalities of 50 percent of wave 1, 100 percent of wave 1, 62 percent of wave 1-to-3, and 100 percent of wave 3 mapped a 611-625 resistance band. A Fibonacci time ratio of 62 percent of the 116-calendar-day June-to-September swing pointed near 7 December.
All readings on this track · 34 readings
- 1984Range grid to sideways break in 1984 gold
- 1985When Gann lines, Gann angles, and a Fibonacci retracement coincide
- 1987Evaluating angular cycle overlays on independent stock swings
- 1988Multi-scale Elliott counts with Gann and Fibonacci confluence
- 1988Gann angles as hand-scaled chart geometry
- 1989A time, price, and pattern filter on one platinum sequence
- 1989Gann angles on point-and-figure grids
- 1990Gann price-time clusters for Elliott retracements
- 1990Channel regimes and Gann angle hinges
- 1990A gold campaign log as a trade procedure
- 1991A fourth Treasury bond resistance test as one time-price hypothesis
- 1991An eclipse calendar as a testable cycle scaffold
- 1992Gann-angle intersections and half-range zones
- 1998Wave and ratio self-similarity as a testable chart hypothesis
- 2000Constructing Gann fan angles from swing extremes
- 2002Combining Fibonacci retracement, Gann angles, and the moving average in FX
- 2002Halfway retracement as a trend confirmation filter
- 2006Volume distribution, Fibonacci extensions, and Gann angles on one downswing
- 2007Constructing Gann fans as currency support and resistance
- 2010ABC completion, wave-two windows, and Gann ratios
- 2010Constructing a Gann, Fibonacci, and decade-scale reversal cluster
- 2010Gann angles as timed tests that still need structure and RSI
- 2010Gann angles heritage is not a signal
- 2010Gann-fan time windows confirmed by Elliott-wave position
- 2010Gann angles as a repeatable chart hypothesis
- 2011Wave and ratio overlays as confirmation, not forecasts
- 2013Gold wave four as a time and price cluster check
- 2014A case study that separates cycle forecasts from Gann and Elliott readings
- 2014Relative charting, Gann angles, and trendline breakouts
- 2016Gann fans and a 2016 long-wave case as checkpoints, not forecasts
- 2017Gann angles, scale dependence, and the gap between legend and method
- 2017Gann angles as overlay, not original practice
- 2018Combine Gann angles, oscillator zones, and a protective stop
- 2020Confirming Gann hi-lo swings with ADX and stochastics