2012issue C0355-57
Cash-rich relative strength as a pre-trade portfolio filter
The archive describes a cash-rich screen that required positive earnings per share and four-week outperformance versus a broad equity index. After a relative-strength rank, the leading name was inspected for support. Covered-call writing is described as working best once the underlying is already in a confirmed bullish trend.
- A cash-rich screen can require a strong cash position, positive earnings per share, and four-week outperformance versus a broad equity index.
- The universe mixed a broad listed-stock list with gold and silver equity lists, then ranked the top 25 names by four-week relative strength after liquidity and price filters.
- The leading name was opened on a daily chart so support and resistance could be inspected for pullback entries.
- Covered-call writing is described as working best when the underlying is already in a confirmed bullish trend with substantial upward momentum.
How the scan was built
The archive describes a scan that can require a strong cash position, positive earnings per share, and four-week outperformance versus a broad equity index. Liquidity and price filters in that scan were set to a 10-day average daily volume of 500,000 and a minimum close of 5, with output limited to the top 25 names.
The scan universe combined a broad listed-stock list with gold and silver equity lists, then ranked results by four-week relative strength versus the index. Relative strength here is a ranking of how a stock performed versus that index over a recent multi-week window. Average daily volume is the liquidity filter used to keep thinly traded names out of the scan.
Four-week outperformance versus the S&P 500 among cash-rich scan names
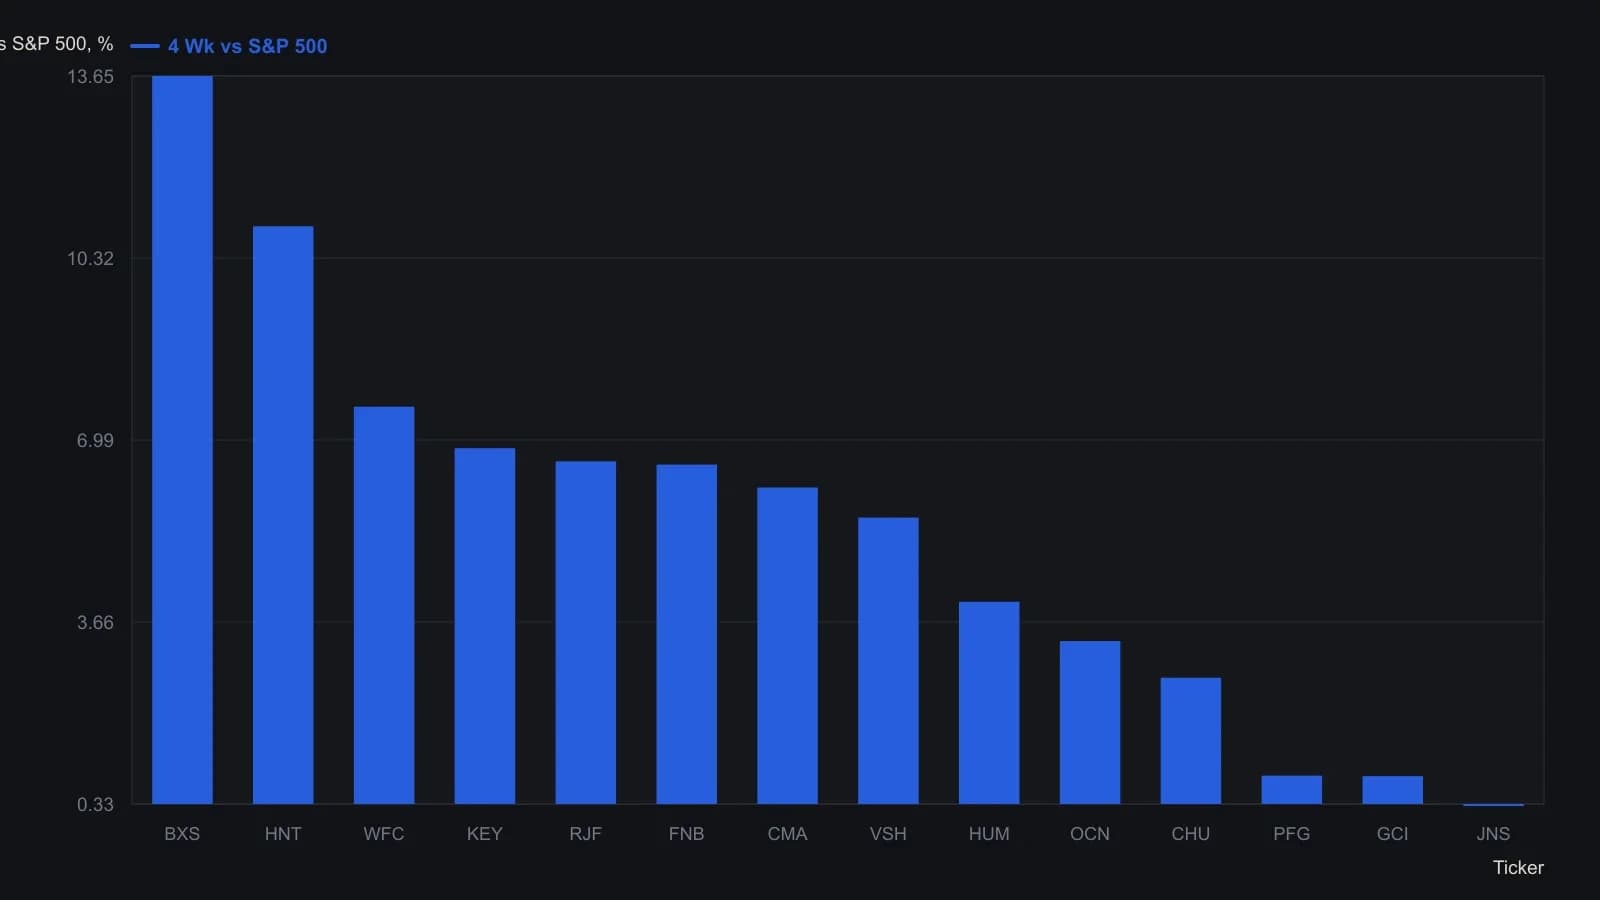
The article’s modified TradeStation scan required close between 5 and 100, 10-day average volume of at least 500,000, market cap of at least $100 million, positive EPS, debt-to-equity below the industry, cash flow per share above the industry, P/FCF in the bottom 25, and the top 25 names versus the S&P 500 over four weeks.
Cash and earnings as a fundamental overlay
Cash strength and earnings quality are treated as a fundamental overlay that should be read together with money flow, moving averages, and support and resistance. The overlay uses cash quality and earnings strength to decide which names belong in a long-only sleeve under a given market regime.
In uncertain or challenging market conditions, names with stronger cash and earnings characteristics are presented as generally preferable for long-only work than weaker-quality names.
Support tests on the leading name
After ranking, the leading name was opened on a daily chart so support, resistance, and other structure could be inspected for pullback entries. Support and resistance are chart levels used to turn a pullback in an established trend into a defined, testable entry hypothesis.
Pullbacks toward support on either an intraday or daily chart are framed as the place to test a long in a stock already in a sustained uptrend.
Covered-call writing after a confirmed uptrend
Covered-call writing is described as working best when the underlying is already in a confirmed bullish trend with substantial upward momentum. It means selling calls against a long stock position, and it is framed as more suitable once that uptrend is already in place.
All readings on this track · 21 readings
- 1991Growth earnings and price-to-earnings as a market-regime overlay
- 1991Earnings-price reliability as a first gate for growth-sleeve construction
- 1991Growth-adjusted earnings years as construction filters
- 1992Constructing an index nominal from smoothed earnings and effective rates
- 1992Real bond yields as a deficit-share regime
- 1994Relative valuation as regime context for fund allocation
- 1995A flattening trendline as a critique of the fundamental overlay
- 1998An earnings-to-price mapping is unfinished until add, reduce, and stand-aside are rules
- 1999Regime-aware stock exposure when rates and market condition agree
- 2002Short-rate velocity regimes before tightening
- 2003A pre-trade checklist that requires rule and fundamental agreement
- 2004Evaluating P/E overlays with matched crossovers
- 2004Constructing a stock-versus-bond regime from earnings yields
- 2012Cash-rich relative strength as a pre-trade portfolio filter
- 2012Inactivity as a feature: a small-cap earnings overlay with a monthly average and weekly MACD
- 2015Evaluating a capitalization-to-output-ratio as a regime overlay
- 2016Risk-adjusted earnings yield as a portfolio overlay
- 2017Oil, yields, and implied volatility as a regime critique
- 2017When a one-year bull sits inside a secular bear
- 2018A critique of rules-only trading systems
- 2019When seasonal and policy regimes override crowd mood