1998issue C071-3
An earnings-to-price mapping is unfinished until add, reduce, and stand-aside are rules
Five-year interval levels of average large-cap earnings and average large-cap prices were reported as linearly correlated, while same-window percent changes were not. A next-period mapping then linked current-window earnings change to the following window's price change. Editorial reading: that mapping is unfinished design work until it is rewritten as a mechanical-trading-system with rule-based-entry and an explicit stand-aside rule, then checked on a later yearly sample to see whether the fundamental-overlay still describes the market that must trade those rules.
- Five-year interval levels of average large-cap earnings and average large-cap prices from 1930 through 1970 were reported as linearly correlated at 92.78 percent, while same-window percent changes were reported as correlated at -4.6 percent.
- Current-window five-year percent changes in average earnings were reported as correlated at 78.33 percent with next-window five-year percent changes in average prices, and the next-period mapping was written as 0.6144 times the current-window earnings change plus 12.1919.
- The mechanical-trading-system used a rule-based-entry that added shares after a positive current-year average earnings change, sold after a negative change, and applied a stand-aside rule after a zero change.
- On a 30-stock industrial average from 1982 through 1997, current-period average earnings change and subsequent-period average price change were reported as correlated at 9.7 percent, a weaker link interpreted as a speculative-regime breakdown.
A mapping is not yet a trading procedure
A fitted next-period mapping can describe how current-window average earnings change related to the following window's average price change.
Editorial reading: that description is unfinished design work until it is rewritten as a mechanical-trading-system. The rewrite has to turn a measured input into add, reduce, or no-trade actions over a stated holding period, with rule-based-entry and an explicit stand-aside rule, before a later yearly sample can test whether the fundamental-overlay still describes the market that must trade those rules.
What the five-year intervals showed
Five-year interval levels of average large-cap earnings and average large-cap prices from 1930 through 1970 were reported as linearly correlated at 92.78 percent.
Over those same five-year intervals, same-window percent changes in average earnings and average prices were reported as correlated at -4.6 percent.
Current-window five-year percent changes in average earnings were reported as correlated at 78.33 percent with next-window five-year percent changes in average prices. The next-window five-year price change was written as 0.6144 times the current-window five-year earnings change plus 12.1919. That fitted link is the next-period mapping.
Rewrite the link as add, sell, or stand-aside
The mechanical-trading-system used a rule-based-entry: add shares after a positive current-year average earnings change, sell after a negative change, and take no trade after a zero change. The stand-aside rule is the instruction to leave position size unchanged when the current-year average earnings change is zero.
The design treated the earnings-to-future-price link as valid only while buyers were profit-seeking participants in future earnings, and as breaking down when speculative buying ignored earnings quality. That premise is the speculative-regime breakdown.
A later yearly sample tests the overlay
Evaluation applied those yearly rules to a 30-stock industrial average from 1982 through 1997, using current-year average earnings change as a fundamental-overlay for the next year's average price direction.
In that yearly 1982-97 sample, current-period average earnings change and subsequent-period average price change were reported as correlated at 9.7 percent. The weaker later-sample correlation was interpreted as consistent with a more speculative regime in which buyers sought price appreciation rather than participation in future earnings.
DJIA yearly earnings change versus next-year price change
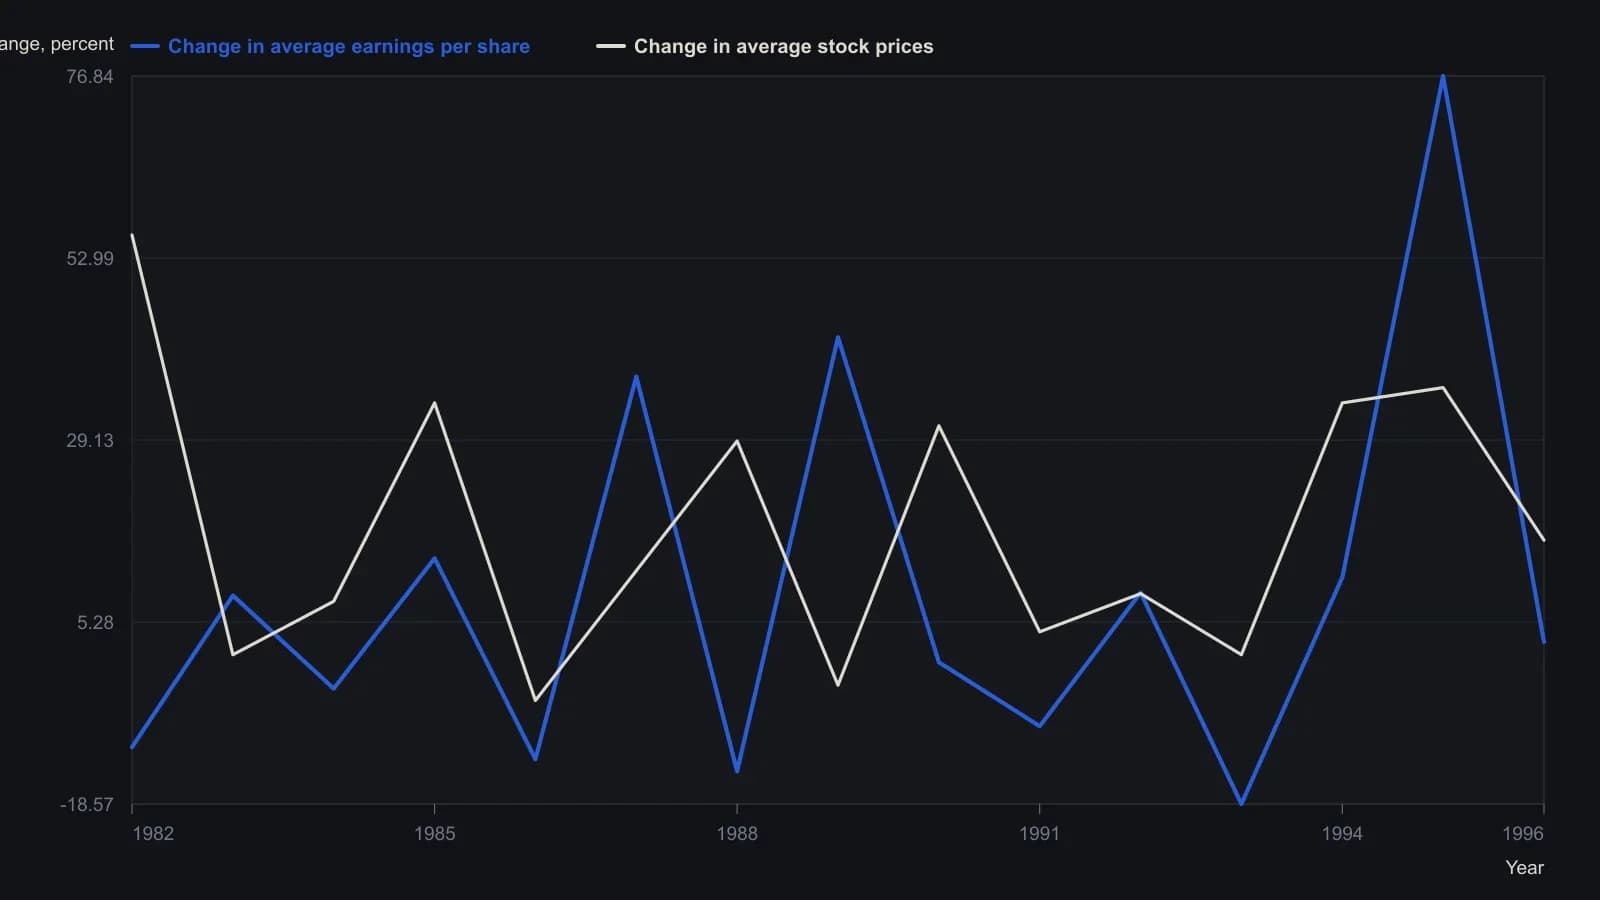
Earnings percents are the article's printed yearly column (1982–96). Price percents are approximate readings from the raster, to about one percentage point. The figure legend treats squares as earnings and diamonds as prices; that squares series matches the printed earnings column. 1997 has no printed earnings change, so both series stop at 1996.
All readings on this track · 21 readings
- 1991Growth earnings and price-to-earnings as a market-regime overlay
- 1991Earnings-price reliability as a first gate for growth-sleeve construction
- 1991Growth-adjusted earnings years as construction filters
- 1992Constructing an index nominal from smoothed earnings and effective rates
- 1992Real bond yields as a deficit-share regime
- 1994Relative valuation as regime context for fund allocation
- 1995A flattening trendline as a critique of the fundamental overlay
- 1998An earnings-to-price mapping is unfinished until add, reduce, and stand-aside are rules
- 1999Regime-aware stock exposure when rates and market condition agree
- 2002Short-rate velocity regimes before tightening
- 2003A pre-trade checklist that requires rule and fundamental agreement
- 2004Evaluating P/E overlays with matched crossovers
- 2004Constructing a stock-versus-bond regime from earnings yields
- 2012Cash-rich relative strength as a pre-trade portfolio filter
- 2012Inactivity as a feature: a small-cap earnings overlay with a monthly average and weekly MACD
- 2015Evaluating a capitalization-to-output-ratio as a regime overlay
- 2016Risk-adjusted earnings yield as a portfolio overlay
- 2017Oil, yields, and implied volatility as a regime critique
- 2017When a one-year bull sits inside a secular bear
- 2018A critique of rules-only trading systems
- 2019When seasonal and policy regimes override crowd mood