1991issue C101-7
Earnings-price reliability as a first gate for growth-sleeve construction
Editorial view: treat growth-sleeve construction as a two-gate problem rather than a cheap-multiple screen. Keep names whose prices have historically paid for reported earnings, rotate into the joint top ranks of that reliability score and multi-year growth, and read the seasoned-growth sleeve as a bull-market overlay.
- Editorial view: specify a growth sleeve with two gates rather than a cheap-multiple screen, first keeping names whose prices have historically paid for reported earnings, then rotating into the joint top ranks of that reliability score and multi-year growth.
- The reliability score is a 0-to-100 mapping of the unadjusted R-square from a five-year fit of log price on log earnings. Readings above 80 mark the earnings-dominated band, and readings below 20 mark the non-earnings band.
- Rank rotation admits names in the joint top ranks on reliability and five-year earnings growth. A tighter overlay adds a consecutive-increase screen and capitalization-weights a book that can add or delete names weekly.
- Editorial view: read the finished seasoned-growth sleeve as a bull-market overlay so a discretionary trading sleeve is not asked to do the same job.
Two gates, not a cheap-multiple screen
Editorial view: specify a growth sleeve as two gates rather than as a cheap-multiple screen. The first gate keeps only names whose prices have historically paid for reported earnings. The second gate rotates into names that jointly rank at the top of that reliability score and multi-year earnings growth.
The archive workflow then reads the finished book through a market-regime lens. Editorial view: treat that book as a bull-market overlay so a discretionary trading sleeve is not asked to do the same job.
How the reliability score is built
Linear regression supplies the first construction input: a five-year fit of log price on log earnings whose unadjusted R-square, scaled by 100, becomes the reliability score. The fit uses natural logs of annual earnings per share and of each year's high-low mid-range price, and it uses unadjusted R-square rather than a degrees-of-freedom-adjusted statistic.
The reliability score is a 0-to-100 mapping of how tightly reported earnings and price have moved together over that lookback.
Earnings-dominated and non-earnings bands
Readings above 80 mark the earnings-dominated band, used to label names whose prices have historically tracked earnings. Readings below 20 mark the non-earnings band, used to label names whose prices have historically been driven by other factors.
Worked examples in the evidence set a high reliability reading at 85.5 and a low reading at 15.9.
Merck earnings versus inverted stock price, 1986–1991
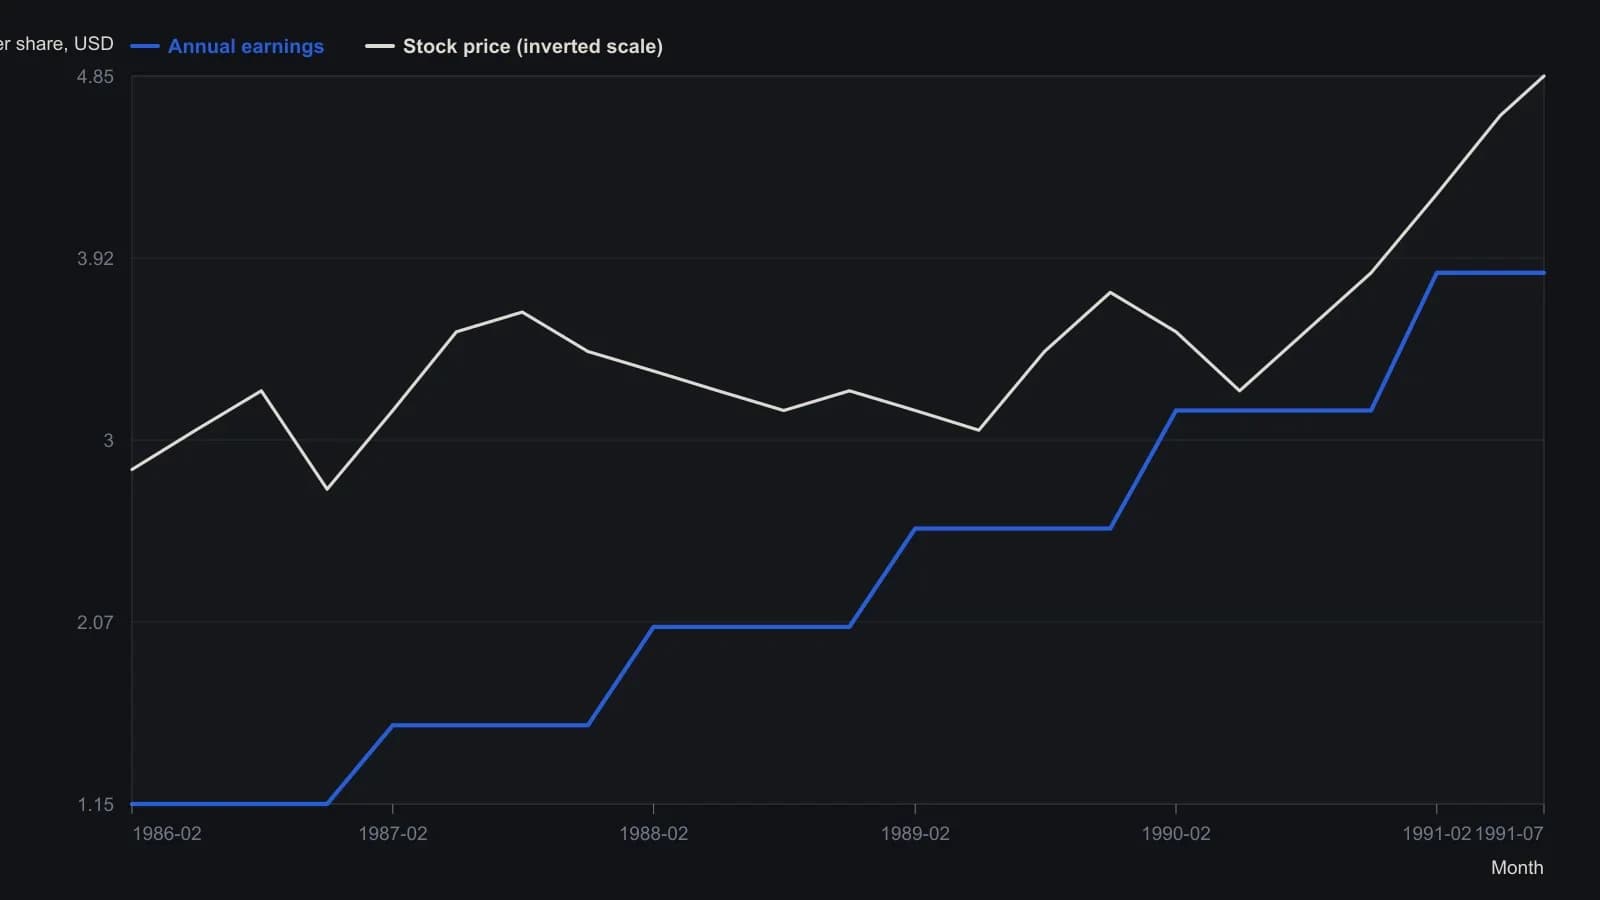
Price is plotted on the inverted right-hand scale used in the source figure so a rising market prints downward; earnings use the left-hand dollars-per-share scale. Points are approximate visual readings from the raster, not official prints.
Joint ranks and the tighter overlay
Rank rotation handles entry, hold, and deletion by joint top-rank membership on reliability and five-year growth, under equal-dollar or capitalization weights and a stated holding or review interval. A construction example equal-dollar-weights names that ranked in the top 50 on both the reliability score and five-year earnings growth as of year-end 1989.
A tighter overlay applies a consecutive-increase screen: earnings must have risen in each of the prior four fiscal years and in current-year interim results before a name can stay in the sleeve. That overlay capitalization-weights a book that can add or delete names weekly.
Fundamental overlay is the rest of the placement test: earnings-growth, consecutive-increase, and market-regime checks that put a single name inside a diversified seasoned-growth sleeve.
Why the book is a seasoned-growth sleeve
The construction case is framed around a seasoned-growth sleeve of large, established names. Less-seasoned low-capitalization names are treated as more exposed to shocks that override the intended earnings factor.
For 478 large seasoned names that remained in a major large-cap universe from year-end 1989 through the end of June 1991, reliability scores at the start and end of those 30 months correlated at 0.57. Once a name is treated as an earnings-momentum story, the reliability label is described as tending to persist.
How to read the finished book
Names that pass the combined filters are described as tending to lead in strong markets and to lag when the broad market is flat or down. Editorial view: that description is a reason to read the sleeve as a bull-market overlay, not as a task for a discretionary trading sleeve.
All readings on this track · 21 readings
- 1991Growth earnings and price-to-earnings as a market-regime overlay
- 1991Earnings-price reliability as a first gate for growth-sleeve construction
- 1991Growth-adjusted earnings years as construction filters
- 1992Constructing an index nominal from smoothed earnings and effective rates
- 1992Real bond yields as a deficit-share regime
- 1994Relative valuation as regime context for fund allocation
- 1995A flattening trendline as a critique of the fundamental overlay
- 1998An earnings-to-price mapping is unfinished until add, reduce, and stand-aside are rules
- 1999Regime-aware stock exposure when rates and market condition agree
- 2002Short-rate velocity regimes before tightening
- 2003A pre-trade checklist that requires rule and fundamental agreement
- 2004Evaluating P/E overlays with matched crossovers
- 2004Constructing a stock-versus-bond regime from earnings yields
- 2012Cash-rich relative strength as a pre-trade portfolio filter
- 2012Inactivity as a feature: a small-cap earnings overlay with a monthly average and weekly MACD
- 2015Evaluating a capitalization-to-output-ratio as a regime overlay
- 2016Risk-adjusted earnings yield as a portfolio overlay
- 2017Oil, yields, and implied volatility as a regime critique
- 2017When a one-year bull sits inside a secular bear
- 2018A critique of rules-only trading systems
- 2019When seasonal and policy regimes override crowd mood