2015issue C1314-17
Evaluating a capitalization-to-output-ratio as a regime overlay
A 2015 evaluation charts a quarterly US capitalization-to-output-ratio from 1957 through 2013 as a slow fundamental overlay. Across three cycle-length-windows it reports a mix of leading and coincident turns versus a broad equity index and does not treat that record as a decisive technical timing system.
- A 2015 evaluation charts the quarterly capitalization-to-output-ratio from 1957 through 2013 as a slow fundamental overlay on valuation, not as a decisive technical timing system.
- Three cycle-length-windows of about 18 years produced a nearly horizontal local-regression-midline in 1957-1974 and 1995-2013 and an upward-sloping midline in 1975-1994.
- Seven overlay peaks and six troughs versus a broad equity index mixed coincident turns with earlier overlay turns. Inflation-adjusted-alignment aligned the series more closely but removed the overlay lead in several signals.
- Editorial takeaway: score the capitalization-to-output-ratio as a regime overlay by reading extremes against a local-regression-midline, then checking leading-versus-coincident-turn and publication-lag before treating a print as timely.
A slow capitalization-to-output-ratio
A 2015 evaluation charts a quarterly US total-equity-capitalization-to-GDP series from 1957 through 2013 as a slow fundamental overlay on market valuation. That series is the capitalization-to-output-ratio: a quarterly comparison of total US equity market value with national output, used here as a fundamental overlay on price rather than as a short-horizon oscillator.
The overlay crossed 0.8 in 1995, moved through 1.00 in January 1998, reached 1.205 by July 1999, and printed 1.535 in January 2000. After 1995 the overlay spent time both above and below 1.0, and a 100-percent-of-output band was marked as a notable two-decade threshold.
Cycle-length-windows and the local-regression-midline
Segmenting 1957-2013 into three windows of about 18 years produced a nearly horizontal linear-regression midline in 1957-1974 and 1995-2013 and an upward-sloping midline in 1975-1994. Each slice is a cycle-length-window, a seasonal-analysis cut of about 18 years chosen so each regime has a stable enough slope to judge local over- and undervaluation.
The line fitted inside each window is a local-regression-midline, so highs and lows can be read as distance from a local center instead of from one full-sample slope. The evaluation treats a local linear-regression line as the practical marker of valuation extremes pending further research.
Leading-versus-coincident-turn results
A count of seven overlay peaks and six troughs versus the same equity index produced a mixture of coincident turns and earlier overlay turns. The article did not treat that record as a decisive technical timing system. Each comparison is a leading-versus-coincident-turn, classifying ratio peaks and troughs according to whether they precede, match, or fail to precede the matching turn in a broad equity index.
In the first window, several overlay troughs led index troughs by one to three quarters, while the 1965 and 1968 overlay peaks gave no advance warning.
In 1974-1994, differing slopes between the overlay and the index made turns harder to see. Extremes through 1983 were largely coincident, while the 1983 peak, 1990 trough, and 1993 peak led the index.
In 1995-2013 the overlay led the 2000 peak and the 2002 trough by two quarters and the 2007 peak by one quarter, while the 2009 trough arrived with the index low.
US capitalization-to-GDP ratio, 1957–2013
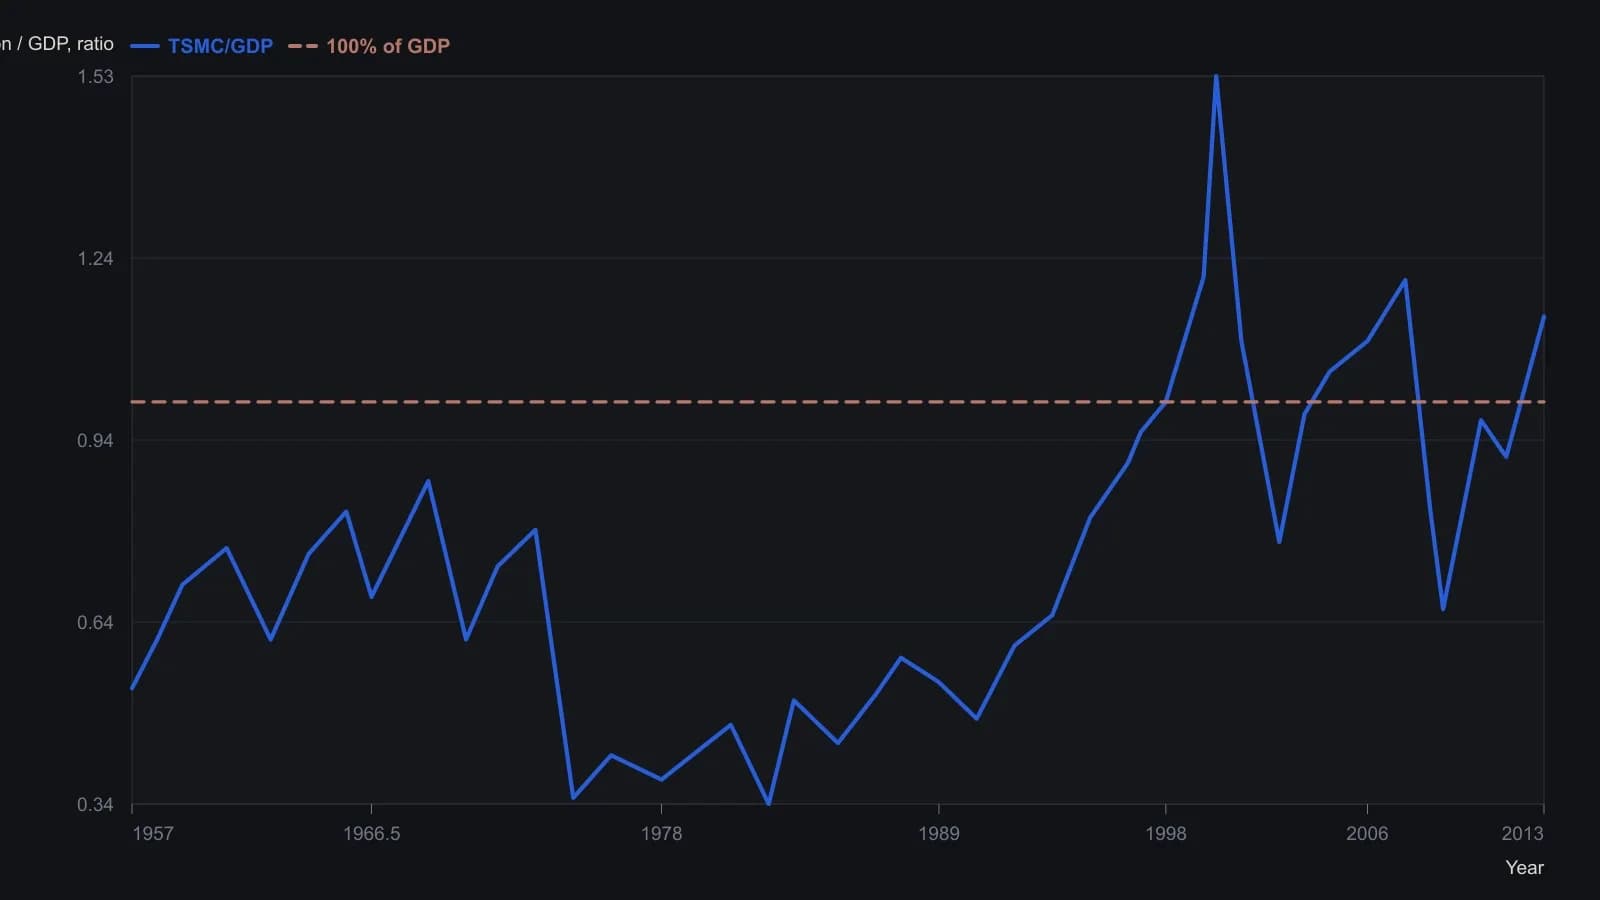
The January 2000 peak (1.535), the July 1999 reading (1.205), and the 1968 high (0.87) are taken from the article text; other points are approximate readings of the plotted quarterly curve. The S&P 500 companion series sits on a separate left-hand scale and is omitted here. The source also cites 0.80 as a mid-1990s buy crossing that is not drawn on this figure.
Inflation-adjusted-alignment
Deflating both the overlay and a broad equity index by a consumer-price index aligned the two series more closely but removed the overlay's lead in several signals. That restatement is inflation-adjusted-alignment, which can tighten visual correlation while erasing some timing leads.
Editorial reading of the archive workflow
Editorial interpretation: the archive presents a scoring workflow for a slow overlay, not a timing system. Readers who want a regime-aware context can keep the capitalization-to-output-ratio next to a local-regression-midline, then require a leading-versus-coincident-turn check before treating any extreme as informative. The mixed turn record, the loss of lead after inflation-adjusted-alignment, and publication-lag all stay attached to that reading.
All readings on this track · 21 readings
- 1991Growth earnings and price-to-earnings as a market-regime overlay
- 1991Earnings-price reliability as a first gate for growth-sleeve construction
- 1991Growth-adjusted earnings years as construction filters
- 1992Constructing an index nominal from smoothed earnings and effective rates
- 1992Real bond yields as a deficit-share regime
- 1994Relative valuation as regime context for fund allocation
- 1995A flattening trendline as a critique of the fundamental overlay
- 1998An earnings-to-price mapping is unfinished until add, reduce, and stand-aside are rules
- 1999Regime-aware stock exposure when rates and market condition agree
- 2002Short-rate velocity regimes before tightening
- 2003A pre-trade checklist that requires rule and fundamental agreement
- 2004Evaluating P/E overlays with matched crossovers
- 2004Constructing a stock-versus-bond regime from earnings yields
- 2012Cash-rich relative strength as a pre-trade portfolio filter
- 2012Inactivity as a feature: a small-cap earnings overlay with a monthly average and weekly MACD
- 2015Evaluating a capitalization-to-output-ratio as a regime overlay
- 2016Risk-adjusted earnings yield as a portfolio overlay
- 2017Oil, yields, and implied volatility as a regime critique
- 2017When a one-year bull sits inside a secular bear
- 2018A critique of rules-only trading systems
- 2019When seasonal and policy regimes override crowd mood