2012issue C0358-61
Inactivity as a feature: a small-cap earnings overlay with a monthly average and weekly MACD
The archive stacks a 48-month moving-average regime, an unoptimized weekly MACD trigger, and a small-cap earnings overlay so a name has to clear several slow gates before it can be held. A TradersWeek editorial reading treats the idle time as the design, a hunt for rare long-hold winners instead of a reason to add more signals.
- A 48-month moving average is the long-horizon technical layer and keeps exposure on only while price remains on the correct side of that lagged baseline.
- A default weekly MACD rule is long-only: it buys when the oscillator rises above zero and sells when the oscillator turns negative.
- The fundamental overlay first requires a market-capitalization cutoff below 300 million dollars and positive earnings for at least four years.
- The stacked design is described as remaining invested only about one-third of the time, a quieter hunt for rare multi-bagger candidates rather than a fuller set of signals.
Three gates instead of more signals
The archive builds a long-hold workflow by stacking three gates rather than by adding extra signals. A multi-year moving-average regime, an unoptimized weekly MACD trigger, and a small-cap earnings overlay all have to agree before a name is held.
The moving average is a lagged trend baseline over a fixed lookback. MACD is a momentum oscillator that converts a price series into a signed long-only signal. The fundamental overlay is a universe and regime filter that requires durable reported earnings, a usable valuation multiple, and a small-capitalization constraint before any technical signal is allowed to fire.
Joint trends in the illustrated winners
One illustrated multi-year winner remained above a 48-month moving average for most of a decade while earnings compounded alongside price. A second illustrated winner is shown with the same sustained joint uptrend in price and earnings, not a price trend alone.
Earnings growth is treated as necessary but not sufficient. One long-term compounder posted earnings growth well above its 10-year price path.
Relative strength is a comparative ranking of a name versus the market or peers. It is described as rising in the stronger price examples and remaining flat where 10-year price progress stayed near or below the market average. Rising relative strength is treated as confirmation that a candidate is behaving like a winner rather than a market-average name.
The three examples are assigned average price-to-earnings levels of about 24, 16, and 19. The existence of earnings is treated as more important than the exact multiple.
The small-cap earnings screen
A stated candidate screen uses a market-capitalization cutoff below 300 million dollars and requires positive earnings for at least four years. That earnings-persistence test is a quality screen: several consecutive years of positive earnings so unprofitable or fad names are removed before a long-hold technical rule is applied.
The names sit in a micro-cap universe, a size-constrained stock set described with a ceiling near one billion dollars, a median near 140 million dollars, and a still tighter hunt below 300 million dollars.
A 48-month regime and a weekly MACD trigger
A 48-month moving average is proposed as the long-horizon technical layer on that small-cap universe. It keeps exposure only while price remains on the correct side of that line. A full-index implementation is described as needing a very large account because of the number of positions.
A weekly MACD long-only rule using default settings is specified as buying when the indicator rises above zero and selling when it turns negative. The unoptimized rule treats a rise through zero as an entry and a turn below zero as an exit, here on weekly bars.
A narrower hunt than the full index
The same earnings overlay can be stacked on that weekly MACD rule. The combined design is described as remaining invested only about one-third of the time.
Combining the technical layer with the fundamental overlay is presented as the preferred hunt for rare multi-bagger candidates when a full small-cap index is too large to trade name by name.
A TradersWeek editorial reading is that the unused share of the calendar should stay unused. The design already has a regime filter, a trigger, and an earnings overlay, and more signals would work against the hunt for rare long-hold winners.
Deckers Outdoor price, 48-month average, and earnings, 2000–2011
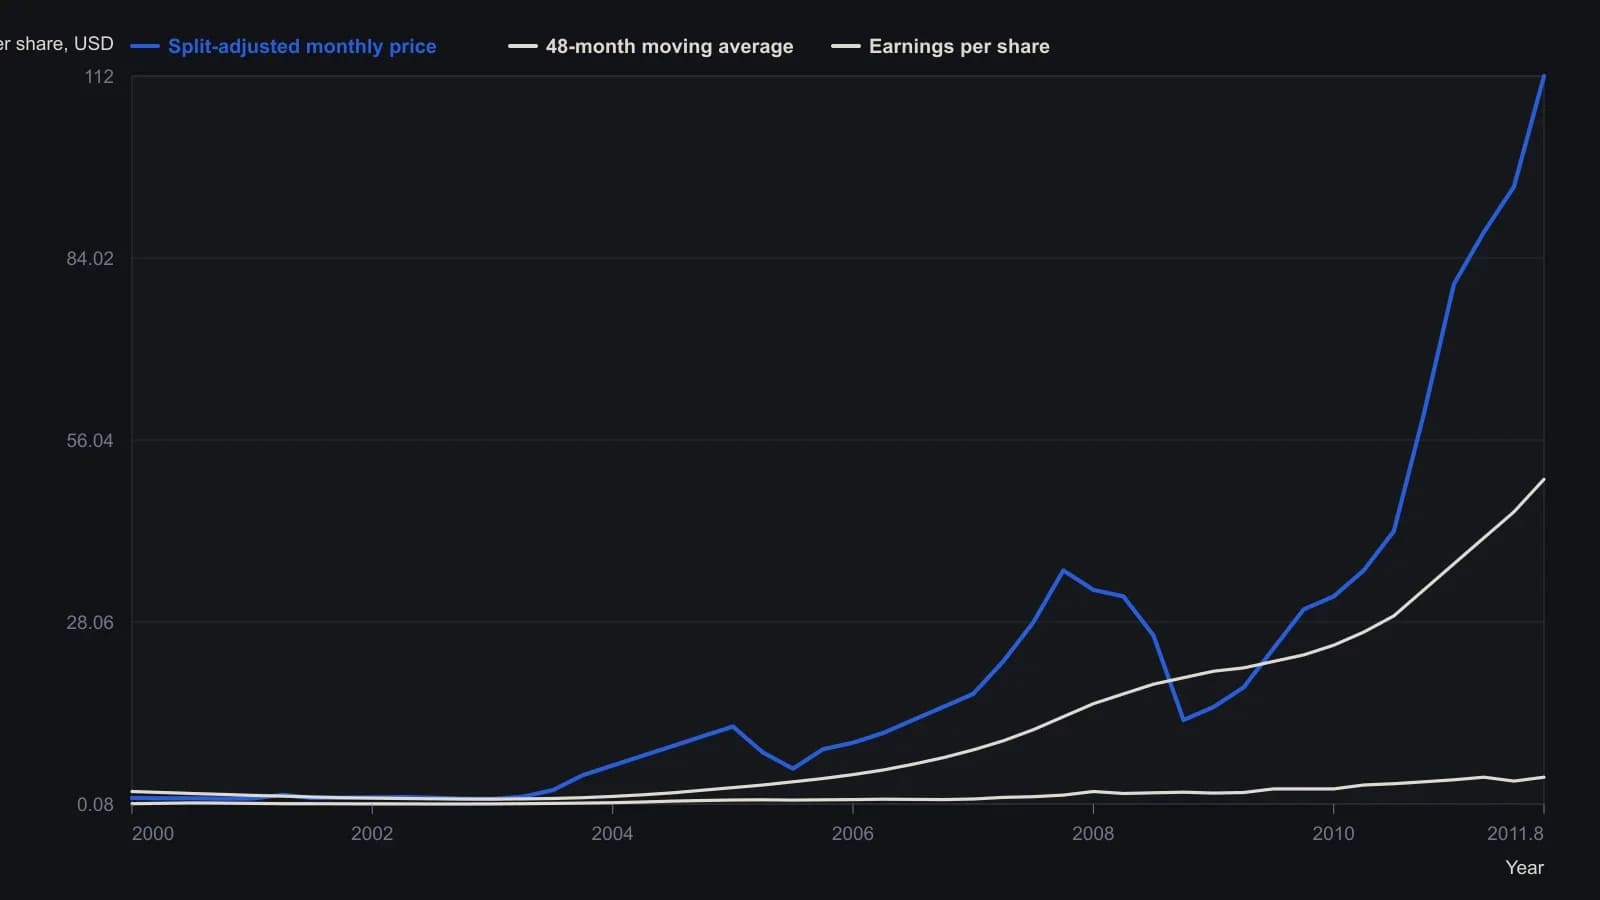
Prices and earnings are already adjusted for the 3-for-1 split of 6 July 2010. The source uses a semi-log grid with price on the right axis and earnings on the left; both are restated here in dollars per share. Volume and the relative-strength line were not digitized. SRC 10-year growth rates are fitted trend rates, not point-to-point CAGRs.
All readings on this track · 21 readings
- 1991Growth earnings and price-to-earnings as a market-regime overlay
- 1991Earnings-price reliability as a first gate for growth-sleeve construction
- 1991Growth-adjusted earnings years as construction filters
- 1992Constructing an index nominal from smoothed earnings and effective rates
- 1992Real bond yields as a deficit-share regime
- 1994Relative valuation as regime context for fund allocation
- 1995A flattening trendline as a critique of the fundamental overlay
- 1998An earnings-to-price mapping is unfinished until add, reduce, and stand-aside are rules
- 1999Regime-aware stock exposure when rates and market condition agree
- 2002Short-rate velocity regimes before tightening
- 2003A pre-trade checklist that requires rule and fundamental agreement
- 2004Evaluating P/E overlays with matched crossovers
- 2004Constructing a stock-versus-bond regime from earnings yields
- 2012Cash-rich relative strength as a pre-trade portfolio filter
- 2012Inactivity as a feature: a small-cap earnings overlay with a monthly average and weekly MACD
- 2015Evaluating a capitalization-to-output-ratio as a regime overlay
- 2016Risk-adjusted earnings yield as a portfolio overlay
- 2017Oil, yields, and implied volatility as a regime critique
- 2017When a one-year bull sits inside a secular bear
- 2018A critique of rules-only trading systems
- 2019When seasonal and policy regimes override crowd mood