2004issue C091-3
Constructing a stock-versus-bond regime from earnings yields
Convert an equity price into an earnings yield, map the Treasury rate into a fair-value and risk-adjusted P/E, then locate a single trade inside that yield gap instead of treating inverse stock-bond correlation as a slogan.
- Divide earnings per share by price and express the result as a percentage so equity income can be compared with a Treasury yield.
- Treat the Treasury rate as an earnings yield to obtain a fair-value P/E, then scale that multiple by a long-run average equity discount so uncertain earnings are not treated as guaranteed coupons.
- Earnings yields need to rise with interest rates through lower prices, higher earnings, or both, and the dominant channel depends on the business cycle.
- Define the regime by whether equities are cheap or expensive relative to the rate-implied P/E, and by whether earnings growth or price adjustment is closing that gap.
Convert the equity into an earnings yield
An earnings yield is constructed by dividing earnings per share by price and expressing the result as a percentage, which inverts the price-to-earnings ratio so equity income can be compared with a Treasury yield. A $1 earnings-per-share figure on a $20 price produces a price-to-earnings ratio of 20 and an earnings yield of 5 percent.
As of mid-June 2004, the 10-year Treasury yield used as the bond-side comparison was about 4.75 percent.
Map the Treasury rate into fair-value and risk-adjusted P/E
Fair-value price-to-earnings is constructed by treating the interest rate as an earnings yield, so a 4 percent rate implies a 25.0 multiple and a 10 percent rate implies a 10.0 multiple. That fair-value P/E is the reciprocal of the Treasury rate.
A risk-adjusted price-to-earnings multiple is the reciprocal of the interest rate multiplied by 1.3, reflecting an average historical 30 percent discount from that fair-value multiple. The scaling keeps uncertain earnings from being treated as equivalent to guaranteed Treasury coupons. The extra expected return required for variable earnings versus a risk-free Treasury yield is the equity risk premium.
The gap between actual and fair-value price-to-earnings has varied widely, from a 95 percent discount in 1941 to a 160 percent premium in 2001.
Treasury-implied fair-value P/E and the risk-premium overlay, 1871–2006
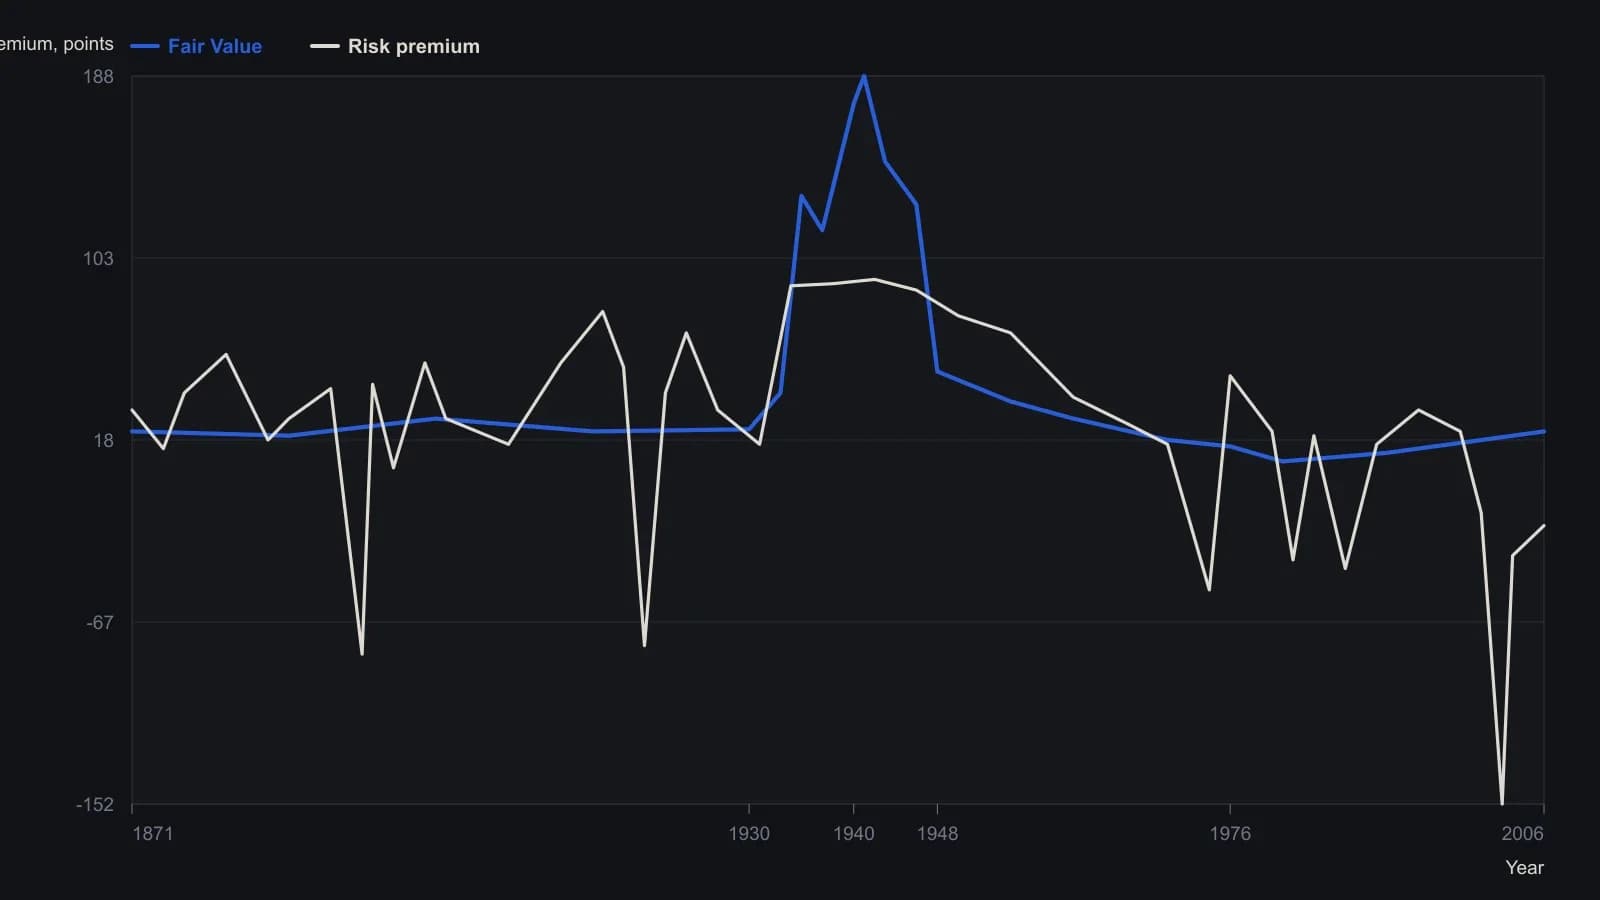
No table appears in the source. Both series were digitized from the line chart (y-axis unlabeled; scale −200 to 200). Fair value tracks the reciprocal of the long-term yield as a P/E. Individual wiggles are approximate.
Read the position inside the yield-gap regime
A yield-gap regime is a cross-market state defined by whether equities are cheap or expensive relative to the rate-implied P/E, and whether earnings growth or price adjustment is closing that gap.
The usual inverse stock-bond link follows from earnings yields needing to rise with interest rates, through lower prices, higher earnings, or both, with the dominant channel depending on the business cycle. Rising rates need not force lower equity prices at once, because stronger demand for money can lift earnings fast enough to offset a contracting multiple until higher rates later slow spending.
Apparent breaks in inverse correlation can occur when equities are still closing a large gap to fair value even as rates fall, as after the 2000 valuation extreme.
Keep the slower secular rate cycle in view
Secular interest-rate trends typically last for decades, with historical bottoms identified in 1898 and 1946. A secular rate cycle of that length can dominate shorter business-cycle swings in earnings and valuation.
All readings on this track · 21 readings
- 1991Growth earnings and price-to-earnings as a market-regime overlay
- 1991Earnings-price reliability as a first gate for growth-sleeve construction
- 1991Growth-adjusted earnings years as construction filters
- 1992Constructing an index nominal from smoothed earnings and effective rates
- 1992Real bond yields as a deficit-share regime
- 1994Relative valuation as regime context for fund allocation
- 1995A flattening trendline as a critique of the fundamental overlay
- 1998An earnings-to-price mapping is unfinished until add, reduce, and stand-aside are rules
- 1999Regime-aware stock exposure when rates and market condition agree
- 2002Short-rate velocity regimes before tightening
- 2003A pre-trade checklist that requires rule and fundamental agreement
- 2004Evaluating P/E overlays with matched crossovers
- 2004Constructing a stock-versus-bond regime from earnings yields
- 2012Cash-rich relative strength as a pre-trade portfolio filter
- 2012Inactivity as a feature: a small-cap earnings overlay with a monthly average and weekly MACD
- 2015Evaluating a capitalization-to-output-ratio as a regime overlay
- 2016Risk-adjusted earnings yield as a portfolio overlay
- 2017Oil, yields, and implied volatility as a regime critique
- 2017When a one-year bull sits inside a secular bear
- 2018A critique of rules-only trading systems
- 2019When seasonal and policy regimes override crowd mood