2002issue C051-4
Regime-first construction of vertical debit spreads
Classify whether options look cheap or expensive against a name’s own historical and implied-volatility path, then convert a directional view into a vertical debit spread only after that volatility regime is set.
- Volatility is framed as disagreement over fair value that appears as larger price swings, with rising uncertainty linked to fewer buyers, seller control, falling prices, higher volatility, and richer premiums.
- Cheap versus expensive is a relative label: implied volatility is stacked against historical volatility or against that contract’s recent implied-volatility range, not against raw percentages on other names.
- Construction is top-down: broad-market trend and volatility, then the stock’s trend and implied volatility across expirations, then the structure.
- Low implied volatility maps to a debit vertical; the archive’s cheap-premium bearish template is a put debit spread kept outside the fastest time-decay window.
This article reconstructs an archive workflow that classifies a volatility regime before it chooses a structure. Historical volatility and implied volatility supply the cheap-versus-expensive label. A vertical debit spread appears only after that label supports a debit design.
Volatility as disagreement
Volatility is framed as disagreement over fair value that appears as larger price swings. Rising uncertainty is linked to fewer buyers, seller control, falling prices, higher volatility, and richer option premiums.
Historical volatility as the baseline
Historical volatility is defined from past price change. It is a backward-looking measure of how far an underlying already moved over a chosen lookback, also called statistical volatility, and it is used as the baseline for judging whether live option prices look rich or cheap.
The archive illustrates a rise from a $70 low to a $100 high as a 30 percent one-year reading. Around a $100 price, the one-standard-deviation band covering about 68 percent of outcomes spans roughly $70 to $130.
Implied volatility as priced future movement
Implied volatility is defined as priced future movement in current option premiums. It is the forward move priced into those premiums through extrinsic value, and it is read relative to the same name’s own history.
A 30 percent historical reading is labeled expensive at 40 percent implied and cheap at 20 percent implied.
Why raw percentages are not cheapness
Raw implied-volatility percentages are not treated as cross-sectional cheapness. One hundred percent can be a yearly low on one name while 50 percent is a yearly high on another.
Broad-market volatility context
A broad-market implied-volatility index on S&P 100 options is presented as nearly the inverse of that cash index. A mid-50s spike is shown alongside index lows around September 2001, versus a prior-decade typical band of about 20 to 30.
A top-down construction sequence
Construction is sequenced top-down. Read broad-market trend and volatility first. Then read the stock’s trend and implied volatility across available expirations. Then choose the structure.
Low implied volatility is mapped to debit verticals, a bull call or a bear put. High implied volatility is mapped to credit verticals, a bull put or a bear call.
In a cheap-premium regime the worked template for a vertical debit spread is a bear put: buy the higher-strike put and sell the lower-strike put at the same expiration for a net debit.
The January 2002 bear put walk-through
In the January 7, 2002 walk-through, a six-month-low broad-market volatility reading and six-month-low implied-volatility readings on the chosen stock from under 30 days through beyond 90 days are used to justify a bearish put debit spread.
The worked vertical buys the April 65 put and sells the April 55 put for a $250 debit. Expiration maximum gain equals the $10 strike width minus that debit, or $750.
The time-decay window
Front-month debit spreads inside 30 days are avoided in the example because decay is described as fastest there. A remaining life of at least 90 days is preferred. That final month before expiration is the time-decay window, and it is treated as a reason to keep a debit vertical outside that window.
CBOE Volatility Index, daily, August 2001–January 2002
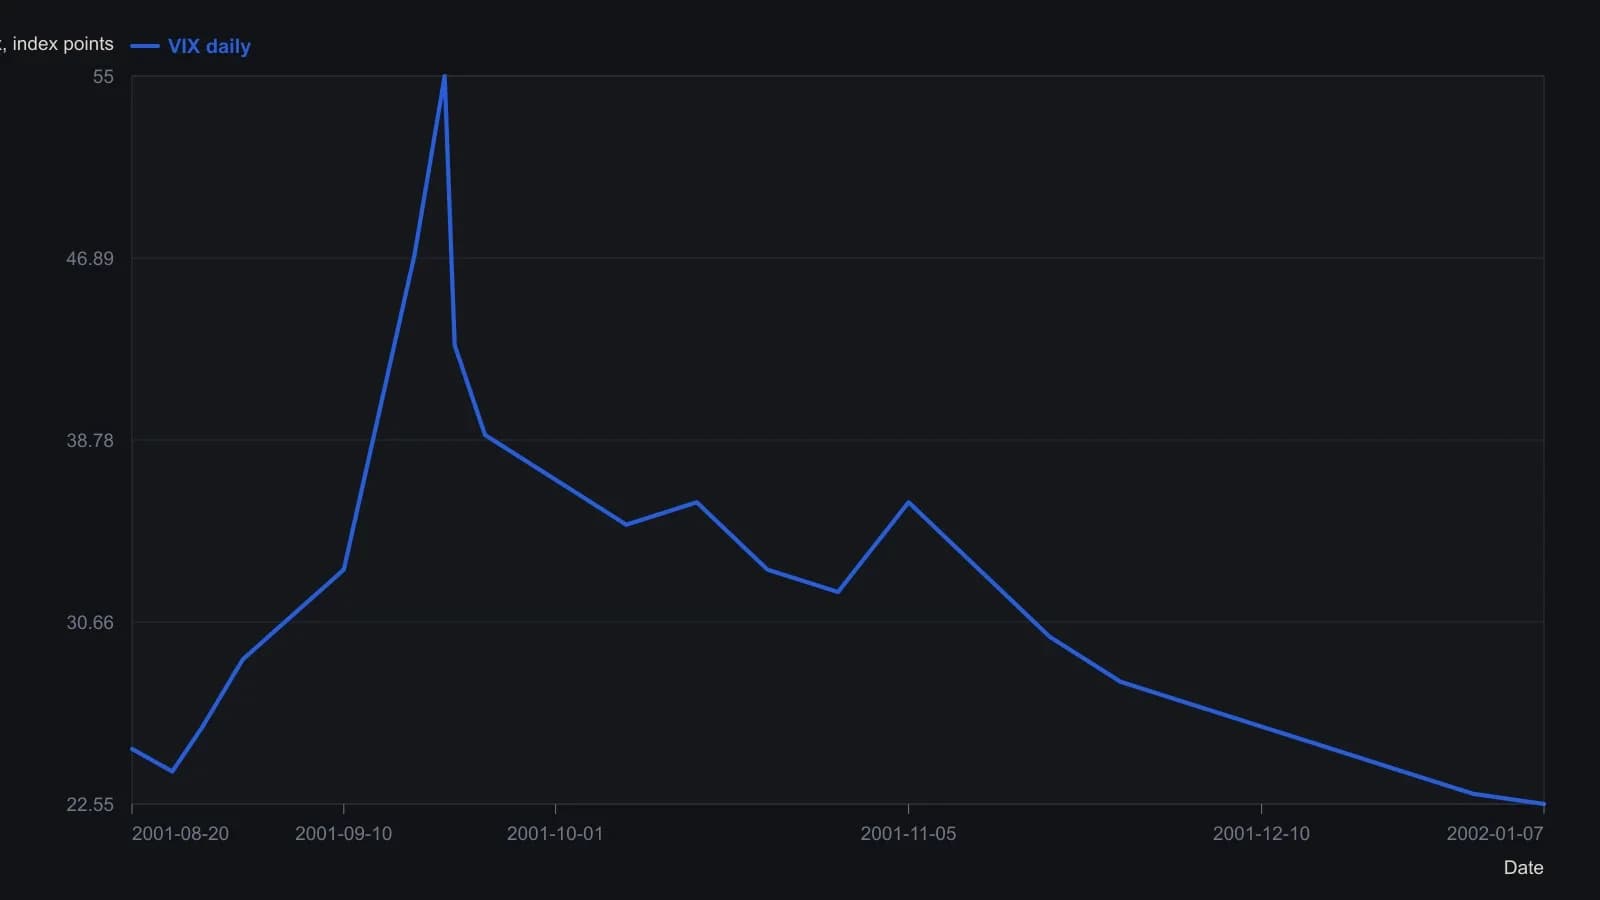
All points except the printed 22.55 close are visual readings and are only good to about one index point. The September extreme is the spike that reached the mid-50s on the pane; intra-day wicks are not a separate series.
All readings on this track · 29 readings
- 1986Rank listed calls against a vertical debit inside one forecast band
- 1990Constructing vertical debit spreads around implied volatility
- 1994Even-money call spread after a stop-limit gap
- 1995Payoff anchors for bull and bear vertical spreads
- 1995Matching vertical spreads to forecast confidence
- 1997A defined-risk short vertical as a single testable procedure
- 1998Vertical debit spreads when implied volatility is elevated
- 2001Constructing vertical debit spreads with a preset risk-reward filter
- 2002Regime-first construction of vertical debit spreads
- 2003Sizing a vertical by the constraint you can enforce
- 2006Event premiums, straddle bias, and volatility-hedged spreads
- 2006From a winning long call to a bull vertical debit spread
- 2007Vertical debit spread construction from codes and premiums
- 2010Vertical construction as a bounded-risk procedure
- 2010Zero-cash repair of an underwater long
- 2011Cheap long calls and in-the-money debit vertical marks
- 2011Vertical debit value path, volatility, liquidity, and box exits
- 2013Constructing defined-risk vertical call spreads
- 2014Protective put versus seasonal debit spread
- 2014One bearish energy thesis, three strike geometries
- 2014Coffee versus equity as a two-sided debit-spread drill
- 2015Natural-gas thesis: ETF drag versus a call debit spread
- 2017Funding a call spread with an offsetting put spread
- 2018An expected-value test for vertical option spreads
- 2019Option ladder construction for financed vertical debits
- 2020One-week call versus bull-put premium tradeoffs
- 2020Constructing in-the-money versus out-of-the-money bull call debit spreads
- 2020Combining vertical debit spreads on a volatility product
- 2025Time decay as a decision variable in an NVDA bull call spread