2015issue C0746-47
Natural-gas thesis: ETF drag versus a call debit spread
The archive first asked whether a listed short-term gas fund actually transmitted a natural-gas view. When that vehicle failed the test, the surviving liquefaction-operator story was written as one vertical debit spread, with implied volatility used to judge the debit rather than the spot-gas print.
- A listed energy product can fail to carry the commodity view it is meant to track, especially when it is a front-month futures ETF that rolls the contracts with the largest drop from futures price to cash price.
- A liquefaction operator can move opposite the gas print when export-terminal capacity and overseas forward orders, not spot gas, are the economic driver.
- A surviving view can be recast as a vertical debit spread, a two-legged option spread that fixes net debit and maximum value at entry and makes the payoff condition explicit.
- Implied volatility is a weeks-to-months regime check on how the option prices themselves may move, not a second vote on the underlying direction.
A two-gate checklist
This archive article is an editorial reading of a historical energy-theme case. It does not restate a live market view.
The editorial checklist has two gates. First, test whether the listed vehicle actually transmits the commodity view. Second, if a view survives, recast it as one defined-risk vertical debit procedure and judge that debit against the implied-volatility regime rather than against a spot-gas story.
Gate one: does the vehicle transmit the view?
UNG was identified as an exchange-traded fund meant to track short-term natural-gas prices. Its listed price was shown in a sustained decline.
The fund was described as a front-month futures ETF: it bought natural-gas futures in the front months only, the contracts with the largest drop from futures price to cash price. That roll was treated as a structural weight on the fund.
UNG was also described as a fee-charging fund. Those fees plus the front-month construction were given as reasons the ETF lagged natural gas on up days and fell more on down days.
In editorial terms, gate one fails when the listed product cannot carry the commodity thesis. A long gas view expressed through this vehicle is then not the same object as a view on the gas print itself.
A different economic driver
LNG was presented as a liquefaction operator, a firm that cools natural gas into a shippable liquid so that export-terminal capacity rather than the spot gas print becomes the economic driver.
Its share price was rising while the gas price was falling. The operator was described as having one facility in place, plans for two more, and existing forward purchase orders tied to higher-priced overseas export shipments.
The archive contrast is simple. The ETF was built around front-month gas futures. The operator was built around terminals and export orders. Those are not interchangeable expressions of the same theme.
UNG share price, December 2014–April 2015
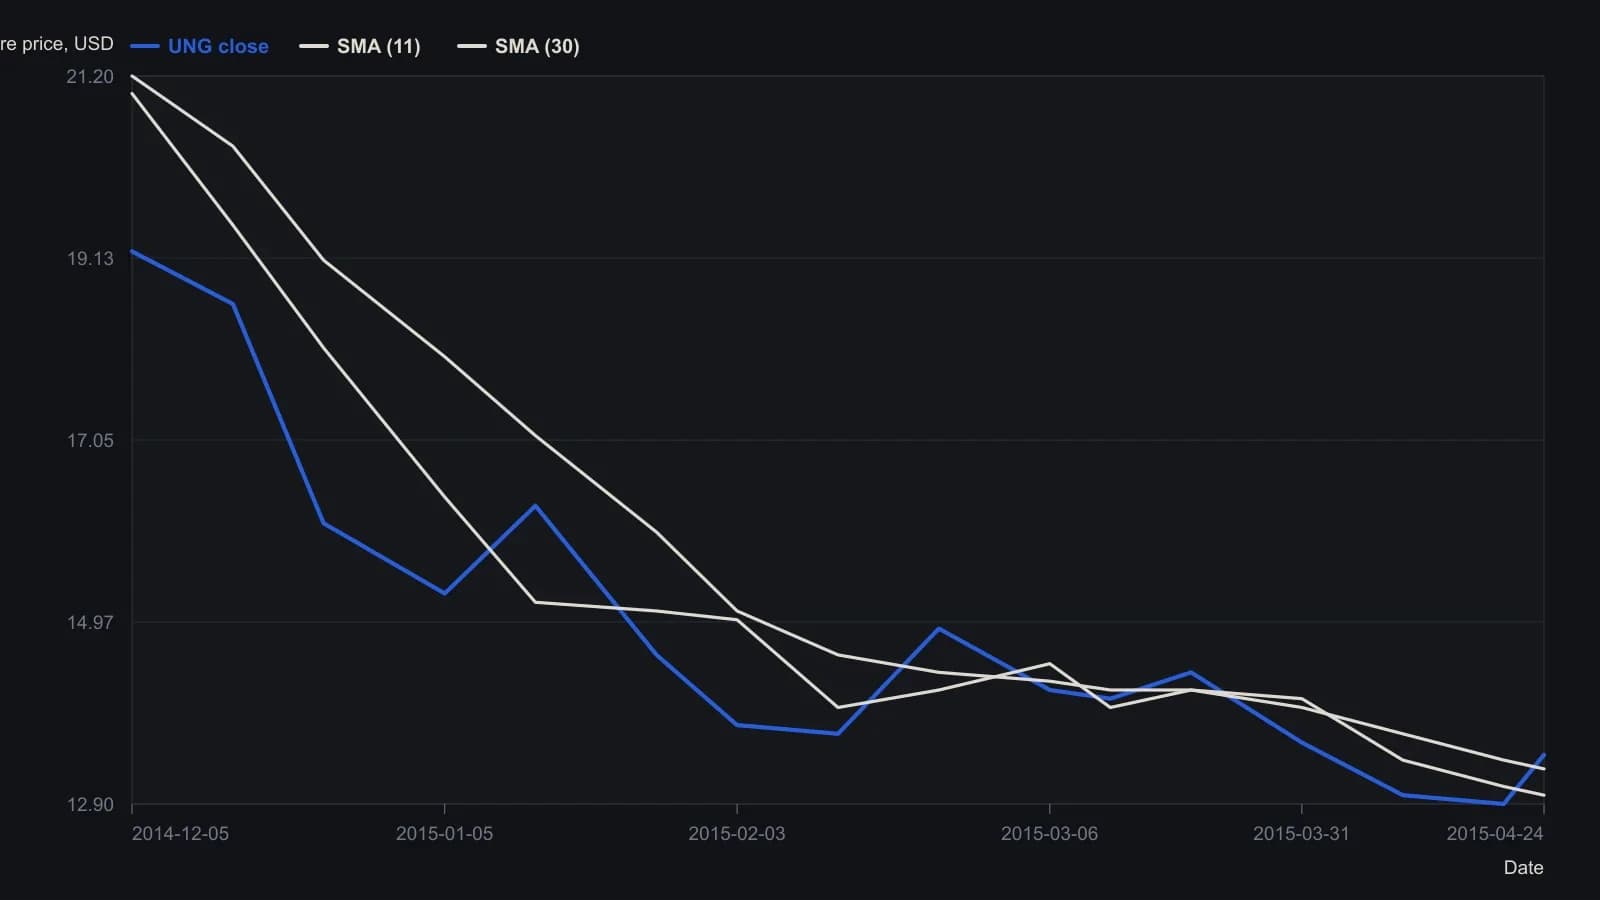
Except for the header close, y-values are raster readings to the nearest 0.1 dollar, sampled at the printed date ticks and at visible swing highs and lows rather than every session.
Gate two: one defined-risk vertical debit
The illustrated structure was a vertical debit spread on the operator: a long call at one strike partly financed by a short call of the same expiry at a farther strike, so net debit and maximum value were both known at entry.
That two-legged option spread turns entry, exit, and abstention into one testable procedure instead of a naked long call.
The accompanying risk graph treated a move in the operator shares to the short-call strike as the condition that completed the designed payoff of the spread.
Judge the debit against implied volatility
The same issue treated measurement of implied volatility as a practical check on how option prices themselves may move, not only on the direction of the underlying.
Implied volatility is the volatility rate already priced into listed options. In editorial use it is a weeks-to-months regime check on whether a debit is rich or cheap relative to the underlying view, rather than a retelling of the spot-gas story.
All readings on this track · 29 readings
- 1986Rank listed calls against a vertical debit inside one forecast band
- 1990Constructing vertical debit spreads around implied volatility
- 1994Even-money call spread after a stop-limit gap
- 1995Payoff anchors for bull and bear vertical spreads
- 1995Matching vertical spreads to forecast confidence
- 1997A defined-risk short vertical as a single testable procedure
- 1998Vertical debit spreads when implied volatility is elevated
- 2001Constructing vertical debit spreads with a preset risk-reward filter
- 2002Regime-first construction of vertical debit spreads
- 2003Sizing a vertical by the constraint you can enforce
- 2006Event premiums, straddle bias, and volatility-hedged spreads
- 2006From a winning long call to a bull vertical debit spread
- 2007Vertical debit spread construction from codes and premiums
- 2010Vertical construction as a bounded-risk procedure
- 2010Zero-cash repair of an underwater long
- 2011Cheap long calls and in-the-money debit vertical marks
- 2011Vertical debit value path, volatility, liquidity, and box exits
- 2013Constructing defined-risk vertical call spreads
- 2014Protective put versus seasonal debit spread
- 2014One bearish energy thesis, three strike geometries
- 2014Coffee versus equity as a two-sided debit-spread drill
- 2015Natural-gas thesis: ETF drag versus a call debit spread
- 2017Funding a call spread with an offsetting put spread
- 2018An expected-value test for vertical option spreads
- 2019Option ladder construction for financed vertical debits
- 2020One-week call versus bull-put premium tradeoffs
- 2020Constructing in-the-money versus out-of-the-money bull call debit spreads
- 2020Combining vertical debit spreads on a volatility product
- 2025Time decay as a decision variable in an NVDA bull call spread