2020issue C096-7
One-week call versus bull-put premium tradeoffs
A constructed one-week case sizes a long-call book and a bull-put-vertical to the same cash-at-risk budget, then grades them by the finish zone the stock is allowed to occupy.
- A long 48-strike call bought at 2.78 and sized to seven contracts needed a finish above 50.78 to show a profit, kept open-ended gain above that level, and faced a 1946 maximum loss at 48 or lower.
- The matching bull-put-vertical sold twenty-eight 49-strike puts at 0.98 and bought twenty-eight 48-strike puts at 0.67, for a 48.69 breakeven, so a one-week decline smaller than 2.9 percent still left the credit book profitable at expiry.
- An unchanged 50.10 close left the long-call book down 476 and the put vertical up its full 868. Near 52.10 the books were nearly even, at 924 versus 868, after which further upside widened the long call's lead.
- Both books sat near full loss below 48. The write-up treated a required sharp one-week rise as the condition that favored the long-call, and an unchanged or only modestly lower close as the condition that favored the put vertical.
A one-week view as two books
The archive set the example stock near 50.10 and sized the long-call book so cash risk stayed just under a stated 2000 one-week loss budget. It then built a matching bullish put vertical under that same cash-at-risk limit.
Editorial view: treat this as a same-budget design problem. Build one option-spread that pays for leftover upside and one book that collects a cushion below spot. Specify each book as one procedure, the way a vertical-debit-spread is specified as one testable book rather than as separate outright legs. Grade the pair by the finish zone the stock is allowed to occupy, not by which payoff diagram looks more aggressive.
The long-call book
A long 48-strike call bought at 2.78 was sized to seven contracts. At expiry that long-call needed the example stock above 50.78 to show a profit, kept open-ended gain above that level, and faced a 1946 maximum loss if the stock finished at 48 or lower.
Option-premium-analysis here reads strike, premium, and breakeven together against spot, the one-week holding period, and the fixed budget. Time-decay, as used here, is the tendency of short-dated long premium to lose value as expiry approaches unless the underlying travels far enough to offset that erosion.
The bull-put-vertical
The matching bull-put-vertical sold twenty-eight 49-strike puts at 0.98 and bought twenty-eight 48-strike puts at 0.67. That credit produced a 48.69 breakeven below the 50.10 spot, so a one-week decline smaller than 2.9 percent still left the credit book profitable at expiry.
The put vertical's best expiry result was a capped 868 if the stock finished at 49 or higher. Its worst result of 1932 at 48 or below was nearly the same cash risk as the long-call book.
Where the expiry grid split the books
An expiry grid showed the long-call ahead only after a sizable rally. An unchanged 50.10 close left the call down 476 and the put vertical up its full 868. On that grid the two books were nearly even near 52.10, at 924 versus 868, after which each further uptick widened the long call's lead. Both books sat near full loss below 48.
The side-by-side expiry curves were also clipped to about one standard deviation of price change so the comparison could be read inside the band treated as where the one-week trade lived, even though a larger move remained possible.
Which close favored which book
The write-up treated a required sharp one-week rise as the condition that favored the long-call's uncapped payoff. It treated an unchanged or only modestly lower close as the condition that favored the put vertical's collected premium.
One-week AMD long-call vs bull-put P/L at expiry
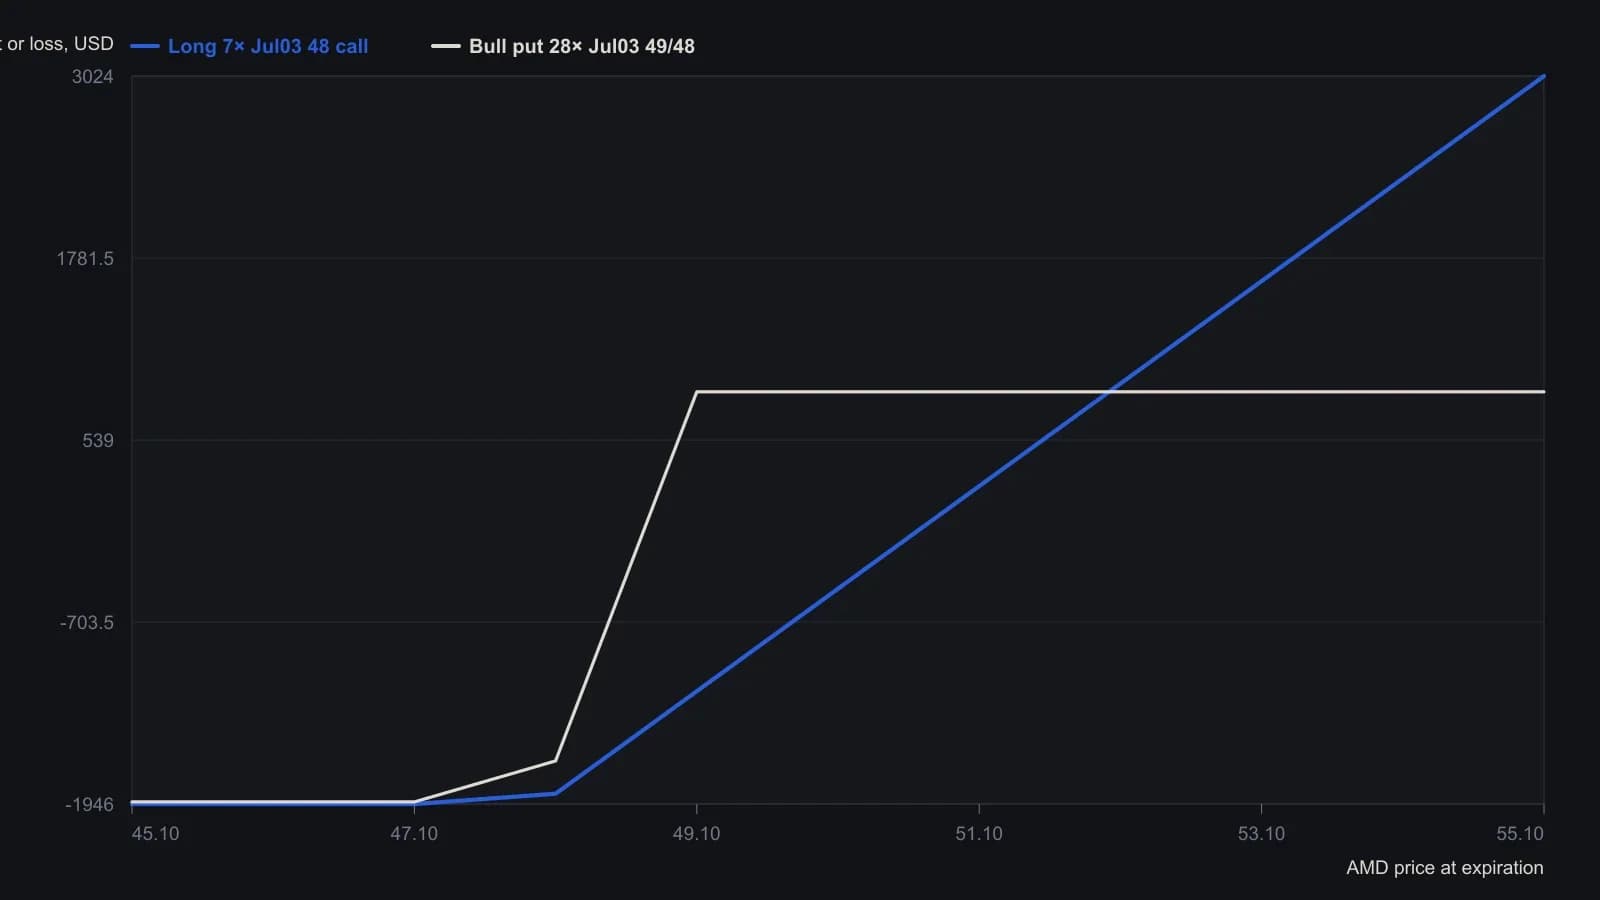
Source table lists AMD at expiration in $1 steps from $55.10 down to $45.10; the $47.10 bull-put cell is printed as (-$,1932) and is read as -$1,932 to match the surrounding rows and the stated max risk. Chart x-axis is ordered low-to-high so the series rise with price.
All readings on this track · 29 readings
- 1986Rank listed calls against a vertical debit inside one forecast band
- 1990Constructing vertical debit spreads around implied volatility
- 1994Even-money call spread after a stop-limit gap
- 1995Payoff anchors for bull and bear vertical spreads
- 1995Matching vertical spreads to forecast confidence
- 1997A defined-risk short vertical as a single testable procedure
- 1998Vertical debit spreads when implied volatility is elevated
- 2001Constructing vertical debit spreads with a preset risk-reward filter
- 2002Regime-first construction of vertical debit spreads
- 2003Sizing a vertical by the constraint you can enforce
- 2006Event premiums, straddle bias, and volatility-hedged spreads
- 2006From a winning long call to a bull vertical debit spread
- 2007Vertical debit spread construction from codes and premiums
- 2010Vertical construction as a bounded-risk procedure
- 2010Zero-cash repair of an underwater long
- 2011Cheap long calls and in-the-money debit vertical marks
- 2011Vertical debit value path, volatility, liquidity, and box exits
- 2013Constructing defined-risk vertical call spreads
- 2014Protective put versus seasonal debit spread
- 2014One bearish energy thesis, three strike geometries
- 2014Coffee versus equity as a two-sided debit-spread drill
- 2015Natural-gas thesis: ETF drag versus a call debit spread
- 2017Funding a call spread with an offsetting put spread
- 2018An expected-value test for vertical option spreads
- 2019Option ladder construction for financed vertical debits
- 2020One-week call versus bull-put premium tradeoffs
- 2020Constructing in-the-money versus out-of-the-money bull call debit spreads
- 2020Combining vertical debit spreads on a volatility product
- 2025Time decay as a decision variable in an NVDA bull call spread