2011issue C1076
Liquidity and open interest as a screen for futures selection
The archive ranked listed futures by how readily the open-interest stock could be traded, using a size-adjusted three-year range and a volume factor. Equal-dollar contract counts and effective percent margin then compared size and margin stretch across markets.
- A relative-contract-liquidity rank orders listed futures by how readily the full open-interest stock can be traded, using size-adjusted range, open interest, and a volume factor.
- Equal-dollar contract count reports how many contracts of each market match the same dollar profit potential, so every entry in that column represents the same dollar amount.
- Effective percent margin expresses margin dollars as a percentage of the three-year dollar range, so margin stretch can be compared across listings.
- Each column is a proportional measure and is meaningful only when one contract is compared with other contracts in the same column.
An execution filter, not a market pick
Editorial: treat listed-futures selection as a liquidity filter first. Rank markets by how densely they can be turned over, then compare equal-dollar size and margin stretch so a single idea is placed only in a contract that can actually be filled.
The archive ranking orders markets by how readily their full open-interest stock can be traded. The densest activity marks stand at the top, and single or empty marks stand at the bottom. Relative contract liquidity is a cross-market rank of how readily a listed futures book can be traded, built from size-adjusted range, open interest, and a volume tilt.
How relative contract liquidity is built
A relative liquidity rank for listed futures is formed by multiplying contract point value, the largest price move observed over the prior three years, open interest, and a volume factor that is usually between 1 and 4.
Relative contract liquidity is also the equal-dollar contract count multiplied by total open interest and by that volume factor. The volume factor is the greater of 1 or the exponential of the natural log of volume divided by the natural log of 5000, minus 2. It down-weights thin volume and lifts very heavy volume.
Equal-dollar size and effective percent margin
An equal-dollar size column reports how many contracts of each market are required to match the same dollar profit potential. That count is computed as tick dollar value times the three-year price excursion, so every entry in the column represents the same dollar amount. The three-year price excursion is the largest price move observed over the prior three years, and it also scales effective margin.
Effective percent margin is margin dollars divided by the three-year dollar range of the contract, then multiplied by one hundred, so margin use can be compared across markets. It expresses initial margin dollars as a percentage of the contract's three-year dollar price range.
A 2011 ranking snapshot
In the 2011 snapshot, short-term interest-rate futures occupied the top of the relative-liquidity ranking, ahead of equity-index, energy, metal, and agricultural contracts.
A share-market turnover proxy
For listed shares, period volume as a percentage of shares outstanding is described as a turnover-rate proxy for trading liquidity that can influence price change.
What the screen is for
Editorial: the screen is a pre-trade liquidity filter that keeps only contracts dense enough to enter and exit, instead of treating thin and active books as interchangeable. Open interest is the stock of outstanding futures contracts used as a scale for how much size the market can absorb. Equal-dollar contract count is how many contracts of one market are needed so each listing is compared on the same dollar profit potential.
Effective percent margin in the March 2019 futures liquidity screen
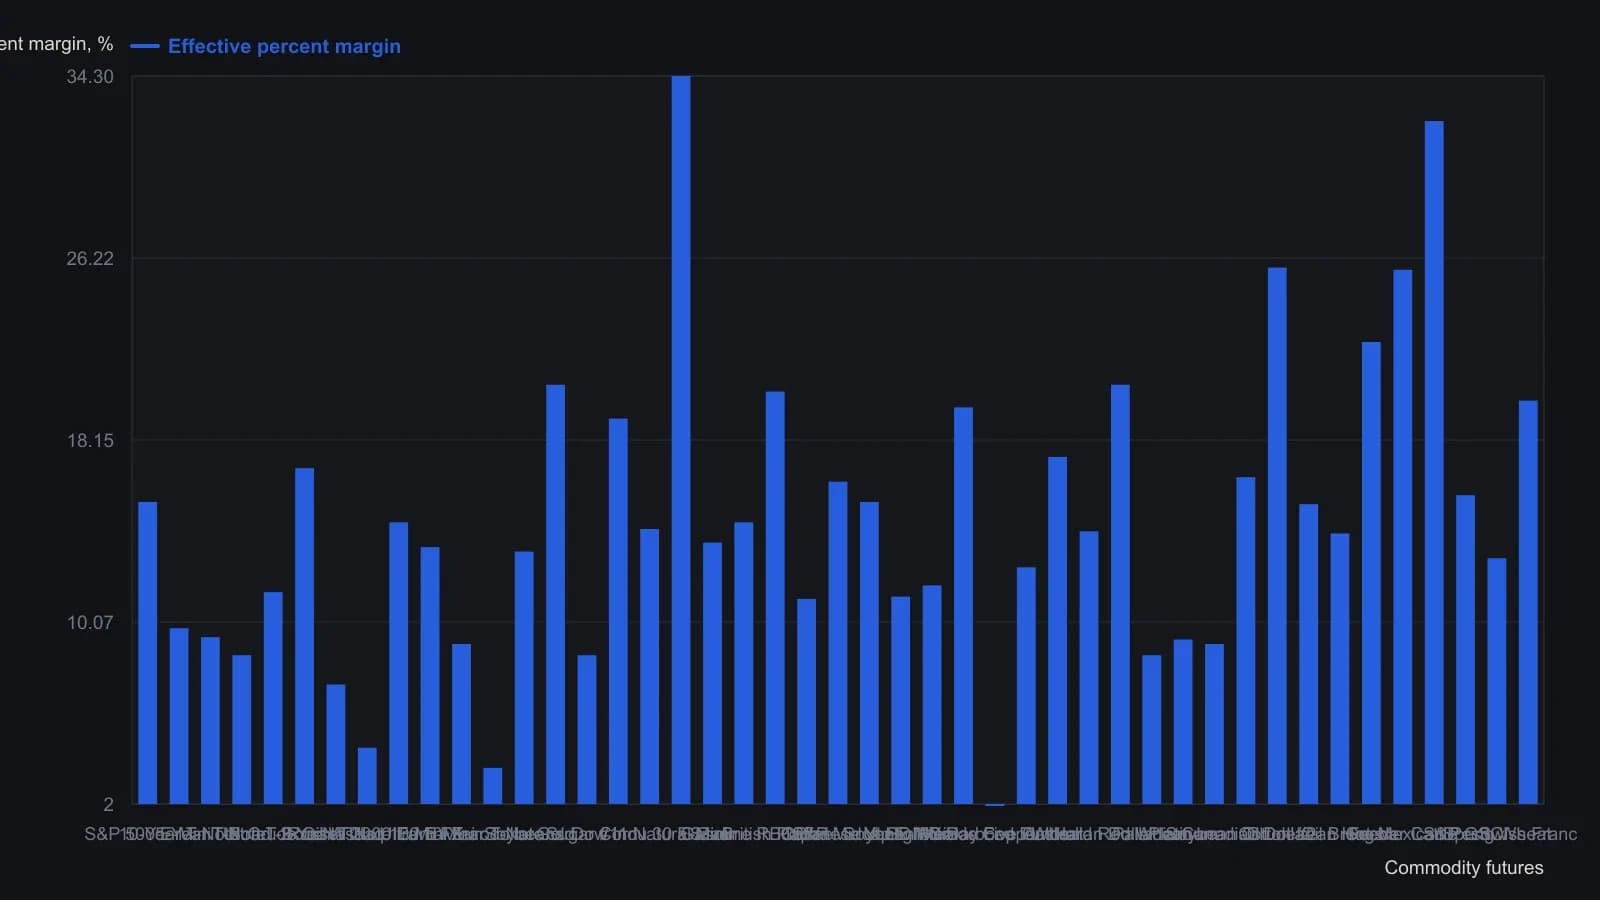
The source ranks contracts by relative contract liquidity (a dot scale built from equal-dollar size, open interest and a volume factor). That score is not printed as a number, so this chart uses the numeric Effective % Margin column from the same table. Effective percent margin is exchange margin divided by the three-year dollar range of the contract, times 100. Values in any column are comparable only with other values in that column.
All readings on this track · 51 readings
- 2002Single-stock futures and the sleeve that belongs on the ticket
- 2007Ethanol futures liquidity lagged the policy boom
- 2010Relative liquidity ranking for futures contract selection
- 2010A liquidity filter for executable futures contract selection
- 2010Screening futures by liquidity, open interest, and equal-dollar size
- 2010Ranking futures liquidity for executable contract choice
- 2010Liquidity and open interest screens for futures selection
- 2010Ranking futures by open interest and equal-dollar liquidity
- 2011Liquidity filter for futures contract selection
- 2011Futures liquidity rank as an execution filter
- 2011Silver contract-selection by size, hours, and carry
- 2011Filtering futures by liquidity, open interest and equal-dollar size
- 2011Liquidity and open interest as a screen for futures selection
- 2011A futures liquidity filter for equal-dollar execution
- 2012Ranking futures liquidity before choosing a contract
- 2013Liquidity-first futures contract selection
- 2013Equal-dollar liquidity filter for futures contract choice
- 2013Futures liquidity filters for executable contract selection
- 2013Filter listed futures by liquidity and open interest first
- 2013Ranking listed futures by liquidity and equal-dollar size
- 2013A pre-trade liquidity filter for futures contract selection
- 2014Why commodity futures are trades, not long-horizon holdings
- 2014Rank futures liquidity before selecting the contract
- 2014Filter futures by equal-dollar liquidity and open interest
- 2015Filter futures contracts by liquidity and open interest
- 2015A two-stage liquidity filter for futures contract selection
- 2015Screen futures contracts by liquidity and open interest
- 2015Equal-dollar futures choice as a liquidity filter
- 2016Evaluate futures liquidity before contract selection
- 2016Ranking futures liquidity before you pick the contract
- 2016Filter listed futures by relative liquidity and open interest
- 2017Evaluating futures liquidity for executable contract selection
- 2017A relative liquidity rank for choosing an executable futures contract
- 2017Constructing a futures liquidity filter for contract selection
- 2017Filter futures by liquidity, open interest, and equal-dollar size
- 2017Rank futures liquidity before contract selection
- 2017Build a futures liquidity filter from open interest
- 2018Evaluating futures liquidity for executable contract choice
- 2018Volume-confirmed pivots versus unregulated spot exposure
- 2018Executable futures selection from a 2018 liquidity board
- 2018Evaluate futures liquidity before contract selection
- 2018Open-interest liquidity filter for futures contract selection
- 2018Construct a futures liquidity filter from open interest and range
- 2018Ranking futures by liquidity, open interest, and equal-dollar cost
- 2019Ranking futures liquidity before contract selection
- 2019Ranking futures liquidity before you pick a contract
- 2019Screening futures by equal-dollar liquidity
- 2020Building an equal-dollar futures liquidity screen
- 2020Use liquidity and open interest as a futures execution screen
- 2020Compact index futures as diversified contract selection
- 2020Filter futures by range-scaled liquidity and open interest