2018issue C0258
Evaluating futures liquidity for executable contract choice
A 2018 archive workflow ranks listed futures by how much open interest and volume stand behind an equal-dollar historical range, then places effective percent margin beside raw margin so the vehicle is chosen for implementability.
- A liquidity filter ranks listed futures from contract point value, a three-year price-motion estimate, open interest, and a volume factor usually between 1 and 4.
- Equal-dollar profit count scales each listing to the same dollar opportunity, and effective percent margin sits beside raw percent margin to compare capital use against that same three-year range.
- Relative contract liquidity is only a within-column comparison of how easily size can be traded. Markets with the densest liquidity marks are treated as the most active, and those with one mark or none as thinly traded and less suitable for speculative execution.
- In the 2018 ranking, the S&P 500 E-mini required two contracts for equal-dollar profit, posted a 3.7 percent margin and an 11.3 effective percent margin, and sat at the top of the relative-liquidity order.
A pre-trade ranking of listed futures
A liquidity filter is a comparative pre-trade ranking of how easily a listed futures contract can be bought or sold relative to other contracts. Open interest analysis uses outstanding contract inventory, scaled with volume, as an input to that ranking. Futures contract selection is the later choice of which listed futures market to use after comparing relative liquidity, equal-dollar size, and margin efficiency.
How the comparative score is built
A comparative futures liquidity score can be built from contract point value, a three-year historical price-motion estimate, open interest, and a volume adjustment usually between 1 and 4. The volume factor is a volume adjustment, often between 1 and 4, that down-weights thin activity and up-weights heavy activity. In this workflow the volume factor is the greater of 1 and the exponential of the natural log of volume divided by the natural log of 5000, minus 2.
Markets with the densest liquidity marks are treated as the most active, while those with one mark or none are treated as thinly traded and less suitable for speculative execution.
Equal-dollar size and effective percent margin
The equal-dollar profit count is how many contracts of one market are needed to match another market's three-year dollar range. The equal-dollar contract count multiplies contract value by the largest price change observed over three years so that every listing in that column is scaled to the same dollar opportunity.
Effective percent margin is the dollar margin divided by the three-year dollar price range of the contract, times 100, and is shown beside raw percent margin to compare capital use. That figure is dollar margin divided by the three-year dollar range of the contract, expressed as a percent.
Effective versus listed percent margin for futures in 2018 liquidity order
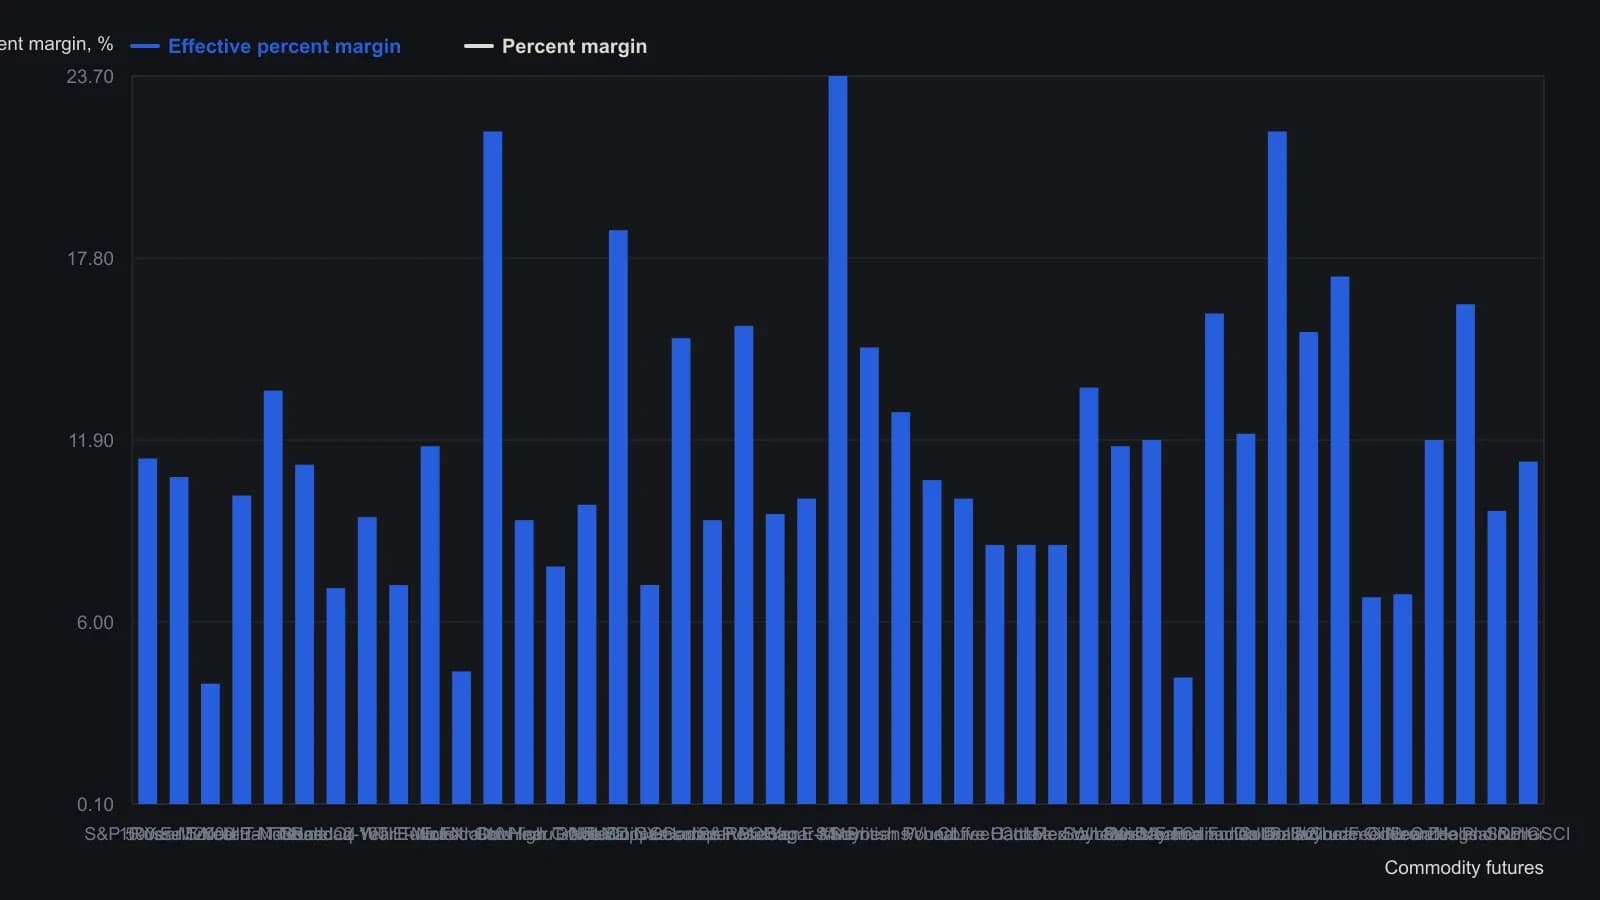
Effective percent margin is margin dollars divided by the three-year contract dollar price range, times 100. Names stay in the source relative-liquidity order, most executable first.
Relative contract liquidity in the 2018 order
Relative contract liquidity is the equal-dollar contract count times total open interest times a volume factor, and it is meaningful only as a within-column comparison of how easily size can be traded. The same quantity is then used to order markets from easiest to hardest to trade.
In the supplied 2018 ranking, the S&P 500 E-mini required two contracts for equal-dollar profit, posted a 3.7 percent margin and an 11.3 effective percent margin, and sat at the top of the relative-liquidity order.
An analogous share-market turnover rate
Share-market liquidity is framed analogously as period volume divided by shares outstanding, a turnover rate offered as a proxy for how easily equity can be traded.
All readings on this track · 51 readings
- 2002Single-stock futures and the sleeve that belongs on the ticket
- 2007Ethanol futures liquidity lagged the policy boom
- 2010Relative liquidity ranking for futures contract selection
- 2010A liquidity filter for executable futures contract selection
- 2010Screening futures by liquidity, open interest, and equal-dollar size
- 2010Ranking futures liquidity for executable contract choice
- 2010Liquidity and open interest screens for futures selection
- 2010Ranking futures by open interest and equal-dollar liquidity
- 2011Liquidity filter for futures contract selection
- 2011Futures liquidity rank as an execution filter
- 2011Silver contract-selection by size, hours, and carry
- 2011Filtering futures by liquidity, open interest and equal-dollar size
- 2011Liquidity and open interest as a screen for futures selection
- 2011A futures liquidity filter for equal-dollar execution
- 2012Ranking futures liquidity before choosing a contract
- 2013Liquidity-first futures contract selection
- 2013Equal-dollar liquidity filter for futures contract choice
- 2013Futures liquidity filters for executable contract selection
- 2013Filter listed futures by liquidity and open interest first
- 2013Ranking listed futures by liquidity and equal-dollar size
- 2013A pre-trade liquidity filter for futures contract selection
- 2014Why commodity futures are trades, not long-horizon holdings
- 2014Rank futures liquidity before selecting the contract
- 2014Filter futures by equal-dollar liquidity and open interest
- 2015Filter futures contracts by liquidity and open interest
- 2015A two-stage liquidity filter for futures contract selection
- 2015Screen futures contracts by liquidity and open interest
- 2015Equal-dollar futures choice as a liquidity filter
- 2016Evaluate futures liquidity before contract selection
- 2016Ranking futures liquidity before you pick the contract
- 2016Filter listed futures by relative liquidity and open interest
- 2017Evaluating futures liquidity for executable contract selection
- 2017A relative liquidity rank for choosing an executable futures contract
- 2017Constructing a futures liquidity filter for contract selection
- 2017Filter futures by liquidity, open interest, and equal-dollar size
- 2017Rank futures liquidity before contract selection
- 2017Build a futures liquidity filter from open interest
- 2018Evaluating futures liquidity for executable contract choice
- 2018Volume-confirmed pivots versus unregulated spot exposure
- 2018Executable futures selection from a 2018 liquidity board
- 2018Evaluate futures liquidity before contract selection
- 2018Open-interest liquidity filter for futures contract selection
- 2018Construct a futures liquidity filter from open interest and range
- 2018Ranking futures by liquidity, open interest, and equal-dollar cost
- 2019Ranking futures liquidity before contract selection
- 2019Ranking futures liquidity before you pick a contract
- 2019Screening futures by equal-dollar liquidity
- 2020Building an equal-dollar futures liquidity screen
- 2020Use liquidity and open interest as a futures execution screen
- 2020Compact index futures as diversified contract selection
- 2020Filter futures by range-scaled liquidity and open interest