2004issue C091-5
Copper as a regime map for cycles and recessions
This archive case treats copper as a regime map. Separate the demand-spin from the cycle clock, then ask whether a price peak is a local metal stall or a broader economic turning point.
- Use copper-as-industrial-proxy logic first: autos, housing, and electronics demand can firm or fade with the economy.
- Separate the demand-spin from the cycle clock before treating a stall as an intermediate-term-top.
- Judge each peak-recession-pairing by how closely the turns line up; later copper highs did not all match recessions cleanly.
- Seek intermarket-confirmation from stocks, housing, and industrial demand instead of reading copper alone.
A metal that maps the growth tape
Copper is presented as a broad industrial input whose demand from autos, housing, and electronics can firm or fade with the economy. That is the copper-as-industrial-proxy reading: the metal is widely consumed in those industries, so its price is a cross-check on housing, autos, electronics, and broader growth.
TradersWeek editorial view: treat that industrial role as a regime map, not as a reason to trade the metal in isolation. First separate the demand story from the cycle clock, then ask whether a price peak is a local copper event or a broader economic turning point.
Demand-spin versus the cycle clock
The 2004 bullish copper narrative is organized around three demand themes: China commodity consumption, US and UK housing strength, and cheap financing of large automobiles. That is the demand-spin in this case: the rally is attributed to growth and cheap auto financing rather than to cycle position.
A copper bull market is framed from autumn 2001 into late spring 2004, with a candidate stall near 1.40 dollars per pound after a rise from just over 60 cents. Cycle work on metals since 1970 is used as the main case that copper may already be making an intermediate-term-top rather than extending that demand story.
A three-year-cycle-low is a recurring copper trough used here as a timing baseline rather than a forecast of magnitude. Three-year cycle lows in 1996 and 1999 are said not to have produced or accompanied a recession, whereas the three- and nine-year cycle low in 2001 is presented as coinciding with one.
As an editorial reading, a coherent demand-spin and an intermediate-term-top can sit on the same chart. The first names why the metal has been bid. The second asks whether the cycle clock is already turning.
Peak-recession pairings are not all clean
One cited intermarket view is that copper peaks and troughs have lined up fairly closely with economic peaks and troughs across the four recessions since 1970. A cited long-horizon view is that copper usually rises in expansions and that a copper peak almost always precedes contraction, with the pattern described as visible on both short and long time frames.
Later peak-recession-pairing cases are treated as imperfect. 1988 is followed by a recession about two years later, and 1994-95 is linked more to a 1994 equity bear market than to a clean recession match. A 1999 copper trough is treated as an ambiguous lead on a later slowdown, while a late-2001 trough is described as arriving in the middle of the turn-of-the-millennium recession.
TradersWeek editorial view: intermarket-confirmation means reading copper together with stocks, housing, and industrial demand. A close historical alignment is not the same as a clean one, so a copper high is a prompt to check the broader turn, not a stand-alone recession call.
Weekly copper from the 1999 and 2001 troughs to the 2004 peak
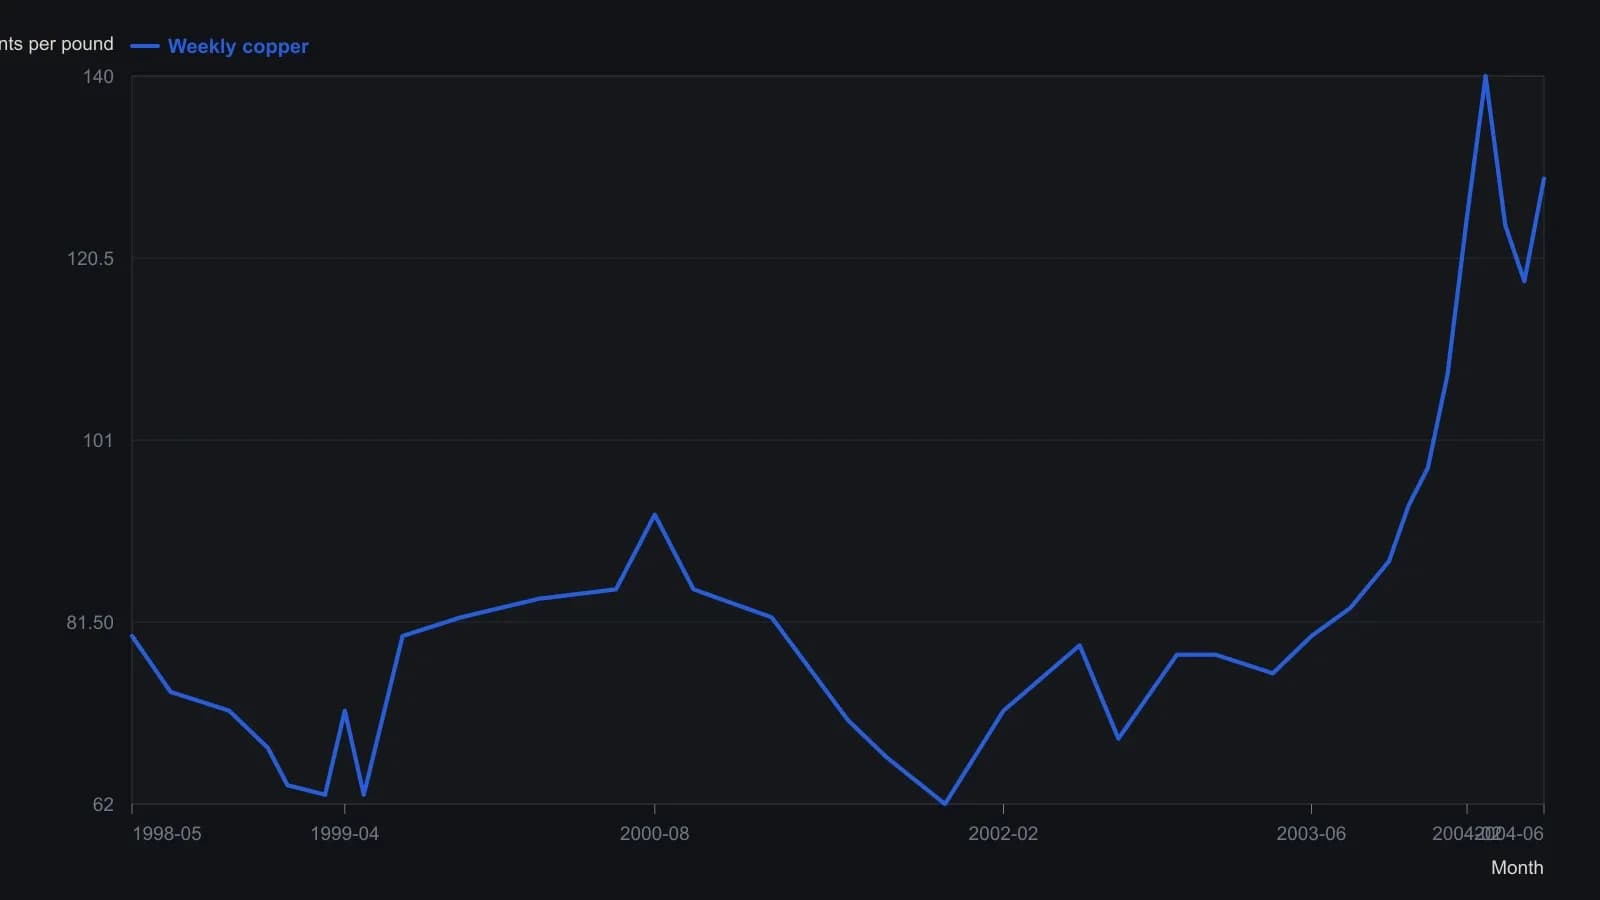
Digitized from weekly HG bars on the eSignal plot. Intermediate prices are approximate to about 1–2 cents; the printed last quote is 12888, or 128.88 cents a pound. The 140-cent peak is visible on the raster and is also stated in the article as historical resistance.
The 2001 to 2004 stall
Copper is described as peaking in mid-2000 and bottoming in the third quarter of 2001, while the official 2001 recession dating begins in March 2001. After that, 2002 is a consolidation year and 2003 is a joint up year for stocks, the economy, and copper. The late-2001 trough therefore sits inside the recession, not neatly ahead of it.
From that trough the archive follows the advance into late spring 2004 and the candidate stall near 1.40 dollars per pound. The teaching contrast is between the China, housing, and cheap-auto demand-spin on one side and the metals cycle case for an intermediate-term-top on the other.
TradersWeek editorial view: the useful question is not whether the demand themes sound real. It is whether the stall is still a copper-only event or whether stocks, housing, and industrial demand give intermarket-confirmation of a wider regime change.
All readings on this track · 21 readings
- 1986Two gates for setup and operator readiness
- 1990Time-only cycle dates in a Treasury bond case study
- 1990Constant-dollar regimes, the value line, and nested cycles
- 1992The four-year election cycle as an equity regime map
- 1992A semiconductor seasonal-index before the relative-strength overlay
- 1992Lock the holiday window as a regime, then veto resistance
- 1995Regime-aware stock screening with intermarket context
- 1996Standard-error bands, width gates, and weekday counts
- 1999Constructing seasonal factors from centered moving averages
- 2000Seasonal window, then weekly breadth
- 2004Copper as a regime map for cycles and recessions
- 2008Election-cycle windows as a mechanical seasonal system
- 2012A 2012 case study in Kondratieff-wave and presidential-cycle overlays
- 2012The October to May window as a mechanical portfolio procedure
- 2013Half-year seasonality as an equity regime overlay
- 2014Seasonal cycles as a regime overlay
- 2015Seasonal oil window as a defined-risk spread case
- 2017Calendar regimes, RSI events, and sector rotation rules
- 2018Seasonal windows as testable entry and abstention rules
- 2019Calendar rotation of seasonal and regime questions
- 2020Constructing calendar interval votes for cycle workbooks