2012issue C1063-70
The October to May window as a mechanical portfolio procedure
A long-only seasonal procedure looks for entries in calendar month 10 and liquidates in calendar month 5. Independent encodings then change the market universe and the coding details around that same calendar window.
- The coded procedure is long-only: it looks for entries in calendar month 10 and liquidates in calendar month 5.
- An October long is taken only when the close is above a 50-period simple moving average and the system is not already long.
- Some encodings treat October as a single entry month; others treat October through April as an allowable long regime and still force a May exit.
- On the two listed funds, one tester counted only 12 completed trades and therefore re-ran the procedure on a wider fund universe and on two futures markets.
The October to May long procedure
The coded procedure is long-only. It looks for entries in calendar month 10 and liquidates in calendar month 5.
Seasonal trading, as defined for this archive article, is that calendar-gated long procedure. It may enter in October and must exit in May, and it may add a price-versus-average test.
An October long is taken only when the close is above a 50-period simple moving average and the system is not already long. That moving-average filter is a go or no-go condition at the seasonal entry. It does not replace the May liquidation.
Independent encodings treat the month-and-average logic as a mechanical trading system: a fully specified entry, exit, and flat-market rule set that can be encoded and backtested as one procedure. Those encodings typically use next-bar or next-day market orders.
One window, two entry rules
The calendar window is the set of months in which the system is allowed to be long versus required to be flat.
Some encodings treat October as a single entry month. Others treat October through April as an allowable long regime and still force a May exit.
The same signal as a small portfolio
The illustrated book is a two-name set described as relatively uncorrelated: a commodity-index fund and a leveraged equity fund. One portfolio illustration of those two names covers 2006 through 2012.
Seasonal analysis, as defined here, is reading the same multi-month window across more than one market so a single seasonal trade sits inside a portfolio context.
One pair-level coding sized each name at 50 percent of equity and capped open positions at two, so the seasonal signal is evaluated as a small portfolio.
Sample length and a wider universe
On the two listed funds, one tester counted only 12 completed trades. Sample length is the number of completed trades available once listed funds have only a short history.
That tester therefore re-ran the procedure on a 10-sector fund universe from 2000 to 2012 and, separately, on two futures markets from 1984 to 2012.
Annual returns of the October-May window on CL and SP, 1984-2012
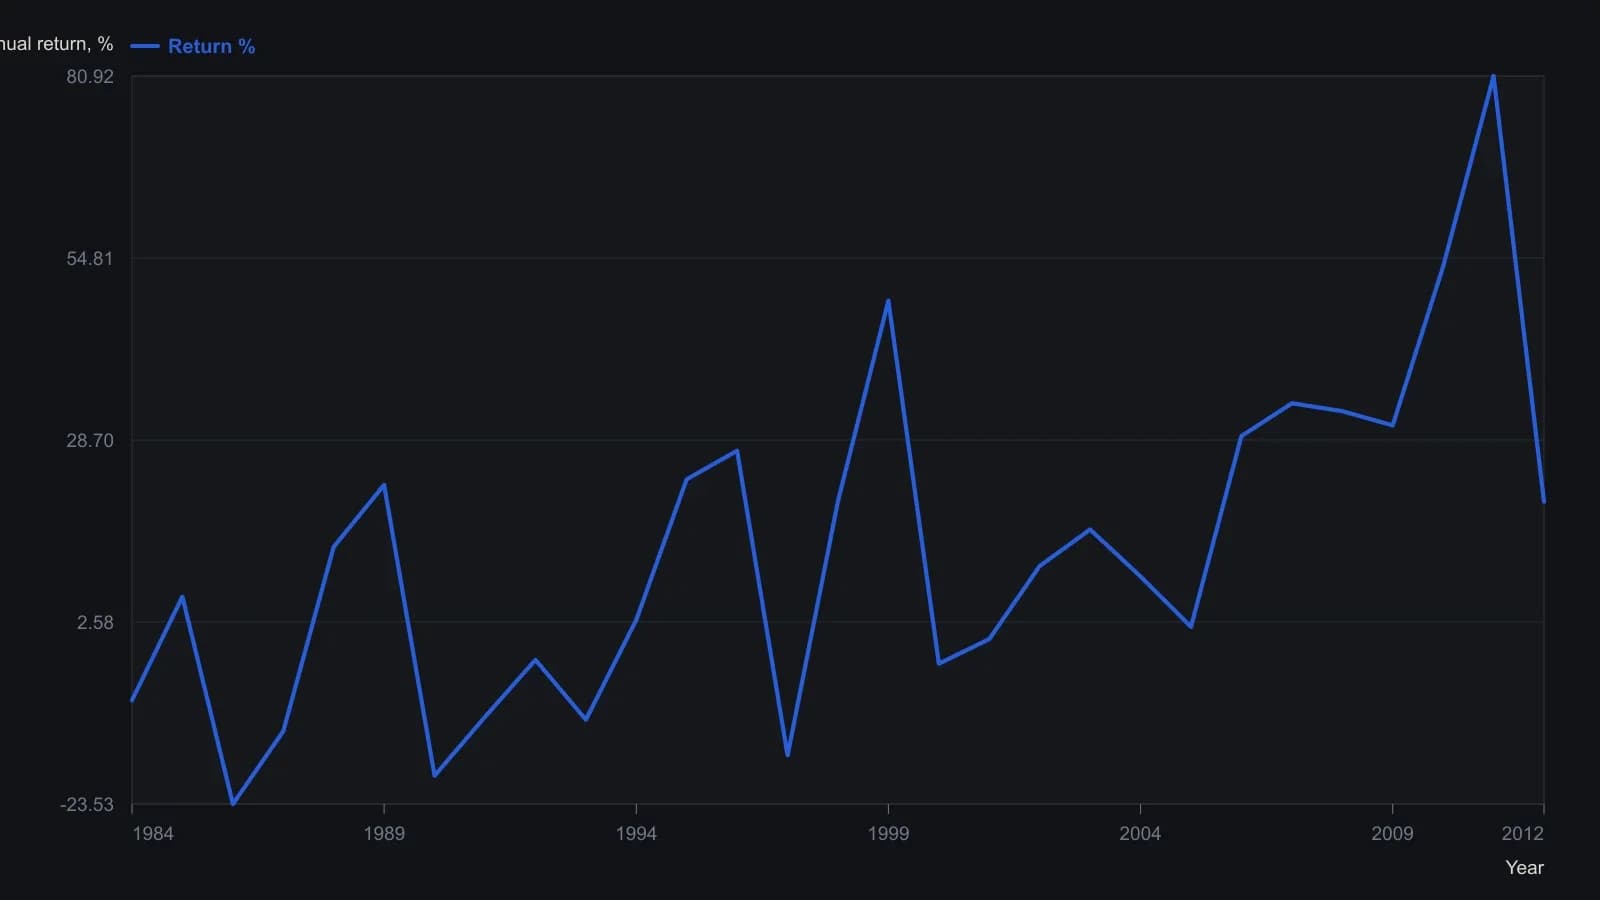
The test started with $500,000 and used CL and SP futures because DBC and DDM produced only 12 trades. 1984-1994 was a net loss with drawdowns near 50 percent; 1994-2012 had smaller 30-35 percent drawdowns. 2012 prints 19.85 percent with zero closed trades, so that year is mark-to-market on open equity.
Signals recovered without the original account path
One spreadsheet recreation recovered the same buy and sell signals as the published examples but could not match the original account results because position-sizing and commission settings were unavailable.
Each name was simulated as a separate 25000 account.
All readings on this track · 21 readings
- 1986Two gates for setup and operator readiness
- 1990Time-only cycle dates in a Treasury bond case study
- 1990Constant-dollar regimes, the value line, and nested cycles
- 1992The four-year election cycle as an equity regime map
- 1992A semiconductor seasonal-index before the relative-strength overlay
- 1992Lock the holiday window as a regime, then veto resistance
- 1995Regime-aware stock screening with intermarket context
- 1996Standard-error bands, width gates, and weekday counts
- 1999Constructing seasonal factors from centered moving averages
- 2000Seasonal window, then weekly breadth
- 2004Copper as a regime map for cycles and recessions
- 2008Election-cycle windows as a mechanical seasonal system
- 2012A 2012 case study in Kondratieff-wave and presidential-cycle overlays
- 2012The October to May window as a mechanical portfolio procedure
- 2013Half-year seasonality as an equity regime overlay
- 2014Seasonal cycles as a regime overlay
- 2015Seasonal oil window as a defined-risk spread case
- 2017Calendar regimes, RSI events, and sector rotation rules
- 2018Seasonal windows as testable entry and abstention rules
- 2019Calendar rotation of seasonal and regime questions
- 2020Constructing calendar interval votes for cycle workbooks