2015issue C0247-48
Seasonal oil window as a defined-risk spread case
This case uses seasonal analysis to place an oil-fund window in portfolio context. It first separates the historically structured stretch from the stretch beside it, then restates the typical path as one defined-risk option spread with a case-study target.
- In the oil-fund case, mid-February to mid-July is treated as the historically structured stretch, while mid-July through mid-February is treated as a stretch without a reliable directional change.
- The illustrated seasonal path is described as averaging about a 10 percent move over that time frame, and applying that figure to a then-current fund price of 23 produces a mid-July case-study target near 25.30.
- The teaching sequence is to confirm the seasonal window first, then consider a bullish stance only inside that window and express it as a defined-risk option structure with an accompanying risk graph.
- After the rule change, brokers must cover a client margin shortfall from the residual-interest buffer by 6:00 pm ET on the following trading day, whether or not the client has already met the call.
A window in portfolio context
This archive case follows an oil-fund seasonal window as a teaching workflow. Seasonal analysis comes first: locate the historically structured stretch and the stretch beside it, then decide whether a directional stance is even eligible.
An editorial reading is that the window is market-regime context for one trade, not a standalone forecast of the average path.
The structured stretch and the stretch beside it
In the oil-fund case, mid-February to mid-July is treated as the historically structured stretch, while mid-July through mid-February is treated as a stretch without a reliable directional change.
The illustrated seasonal path is described as averaging about a 10 percent move over that time frame.
A price target from an average move
A price target from an average move is a case-study target formed by applying a typical seasonal percentage move to the then-current price.
Applying that 10 percent figure to a then-current fund price of 23 produces a mid-July case-study target near 25.30.
One defined-risk option spread
The teaching sequence is to confirm the seasonal window first, then consider a bullish stance only inside that window and express it as a defined-risk option structure with an accompanying risk graph.
An editorial reading is that seasonal trading keeps entry, the case-study target, and abstention outside the window in one testable sequence, and that the option spread is how that stance is written as a defined-risk structure with a risk graph.
Defined-risk call payoff versus stock price by days to expiration
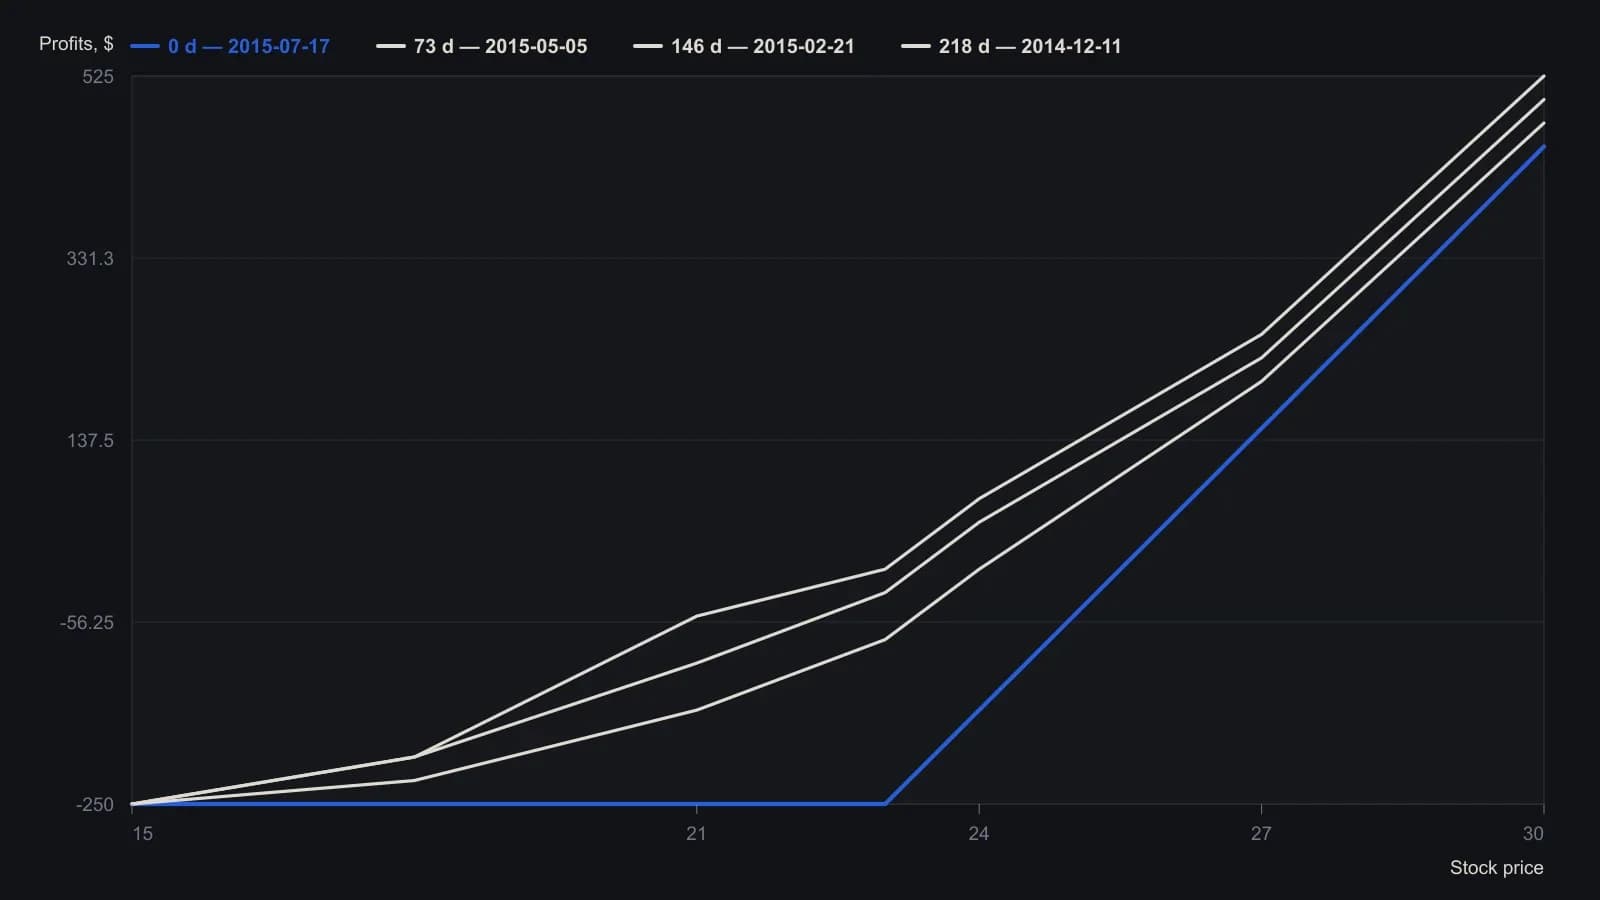
Expiration geometry implies a $23 strike and a $250 debit on a standard 100-share contract. Intermediate-date curves are approximate raster readings rounded to the nearest $25.
Residual interest and faster shortfall funding
Residual interest is a required extra cash cushion held with client funds so a broker can cover a client deficit without using another client account. The residual-interest buffer is extra cash held above client deposits so a customer loss beyond the account balance does not immediately create a shortfall in segregated funds.
After the rule change, brokers must cover a client margin shortfall from that buffer by 6:00 pm ET on the following trading day, whether or not the client has already met the call.
The same-day grace that used to last one to three sessions without automatic cost or liquidation is replaced by faster firm-level funding, so many brokers add daily or stepped fees after day one, or they liquidate instead. A margin-call fee is a daily or stepped charge that starts after a one-day window to discourage leaving a deficit open.
An editorial reading is that these funding rules are part of the market-state and execution context around the option spread, not a second forecast.
All readings on this track · 21 readings
- 1986Two gates for setup and operator readiness
- 1990Time-only cycle dates in a Treasury bond case study
- 1990Constant-dollar regimes, the value line, and nested cycles
- 1992The four-year election cycle as an equity regime map
- 1992A semiconductor seasonal-index before the relative-strength overlay
- 1992Lock the holiday window as a regime, then veto resistance
- 1995Regime-aware stock screening with intermarket context
- 1996Standard-error bands, width gates, and weekday counts
- 1999Constructing seasonal factors from centered moving averages
- 2000Seasonal window, then weekly breadth
- 2004Copper as a regime map for cycles and recessions
- 2008Election-cycle windows as a mechanical seasonal system
- 2012A 2012 case study in Kondratieff-wave and presidential-cycle overlays
- 2012The October to May window as a mechanical portfolio procedure
- 2013Half-year seasonality as an equity regime overlay
- 2014Seasonal cycles as a regime overlay
- 2015Seasonal oil window as a defined-risk spread case
- 2017Calendar regimes, RSI events, and sector rotation rules
- 2018Seasonal windows as testable entry and abstention rules
- 2019Calendar rotation of seasonal and regime questions
- 2020Constructing calendar interval votes for cycle workbooks