2008issue C021-5
Election-cycle windows as a mechanical seasonal system
A mechanical trading system stayed long the Dow Jones Industrial Average for 26 months from a midterm-year late-September low through an election-year late-December high, then stood aside for 22 months. Cycle counts from 1902 through 2006 and a later Dow 30 simulator compared that seasonal trading rule with a buy-and-hold control.
- The procedure is one long window and one abstention window on the election calendar, not a forecast of who wins.
- Across 104 cycles from 1902 through 2006, the 26-month window captured more than 93 percent of index gains, against a length-only split near 56:44.
- A composite of 19 cycles from 1928 to 2004 placed the low at the end of September in each midterm year and the high at the end of December in each election year.
- In a 1994-2006 Dow 30 simulator, the election-window book finished near buy-and-hold, while the inverse post-election window returned 1.17 percent.
The mechanical long and abstention windows
The historical workflow defined a mechanical trading system that was long the Dow Jones Industrial Average for the 26 months from a midterm-year late-September low through an election-year late-December high, and was out of the market for the following 22 months. That seasonal trading rule was tested on 104 cycles spanning 1902 through 2006.
A length-only split as the no-effect check
If election timing had no effect, those 26-month and 22-month windows would have been expected to split results near 56:44, or about 1.2 to 1, solely because of their unequal lengths. In that 1902-2006 comparison, the 26-month pre-election window captured more than 93 percent of the index gains and the inverse 22-month window captured 7 percent.
The composite cycle from midterm September to election December
A composite of 19 election cycles from 1928 to 2004 placed a cycle low at the end of September in each midterm year and a cycle high at the end of December in each election year, 26 months later.
A later Dow 30 simulator and the buy-and-hold control
A later implementation bought the Dow 30 basket on the last trading day of September 1994, sold on the last trading day of December 1996, and both that timed book and a contemporaneous buy-and-hold book were recorded at 165687.26 after commissions from a 100000 start.
Over the same 1994-2006 simulator run, the election-window book finished at 335631.62, a 235.6 percent total return, while buy-and-hold finished at 321257 after a 221.3 percent total return. The inverse post-election window in that simulator run returned 1.17 percent, and a three-year post-election grouping was recorded at 13.3 percent with a 28 percent maximum drawdown in 2001.
Year-type totals in the same span
Year-type totals for the Dow from 1994 through 2006 were 103.7 percent in pre-election years, 27.3 percent in election years, 21.8 percent and 9.3 percent on the accompanying per-trade figures for those two year types, 21.0 percent and 8.5 percent in midterm years, and 13.3 percent and 5.3 percent in post-election years.
Why the control stays in the case
Editorial reading: the buy-and-hold control is why TradersWeek treats this as seasonal analysis and a portfolio-context decision. The timed book and the always-invested book can finish near each other even when the inverse window contributes little, so the calendar is a question of when capital is committed rather than a claim about election outcomes.
Dow 30 equity in post-election calendar years, 1995–2006
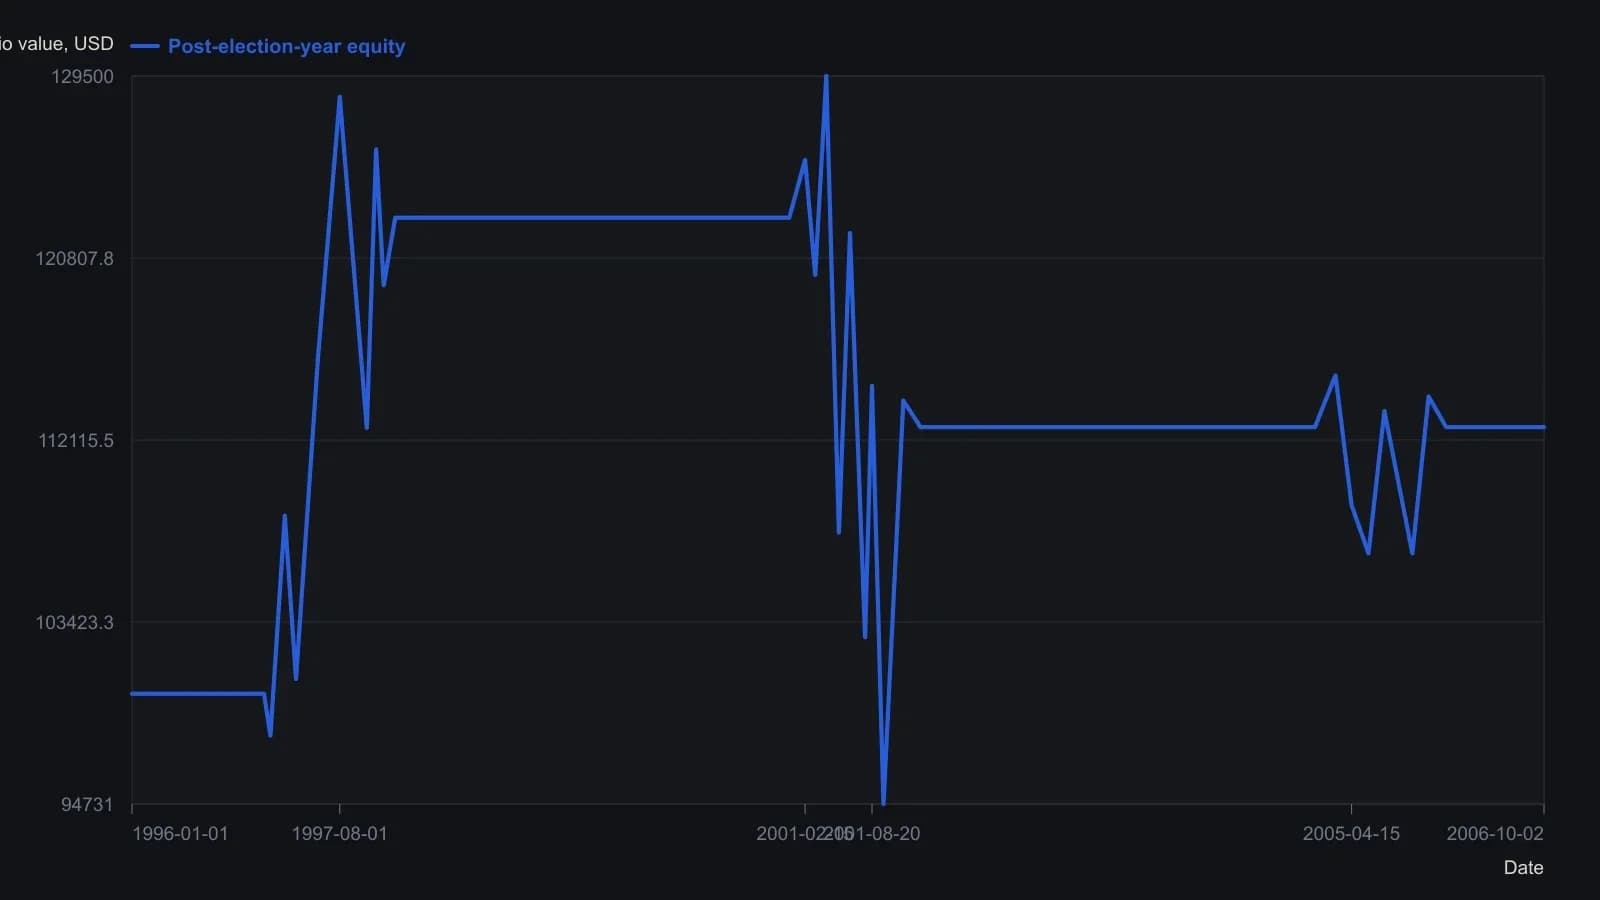
In the market only during calendar post-election years 1997, 2001 and 2005; cash otherwise. VectorVest Simulator on the Dow 30 basket with commissions. Y-values are read from the published $2,000 grid and are approximate between labeled ticks.
All readings on this track · 21 readings
- 1986Two gates for setup and operator readiness
- 1990Time-only cycle dates in a Treasury bond case study
- 1990Constant-dollar regimes, the value line, and nested cycles
- 1992The four-year election cycle as an equity regime map
- 1992A semiconductor seasonal-index before the relative-strength overlay
- 1992Lock the holiday window as a regime, then veto resistance
- 1995Regime-aware stock screening with intermarket context
- 1996Standard-error bands, width gates, and weekday counts
- 1999Constructing seasonal factors from centered moving averages
- 2000Seasonal window, then weekly breadth
- 2004Copper as a regime map for cycles and recessions
- 2008Election-cycle windows as a mechanical seasonal system
- 2012A 2012 case study in Kondratieff-wave and presidential-cycle overlays
- 2012The October to May window as a mechanical portfolio procedure
- 2013Half-year seasonality as an equity regime overlay
- 2014Seasonal cycles as a regime overlay
- 2015Seasonal oil window as a defined-risk spread case
- 2017Calendar regimes, RSI events, and sector rotation rules
- 2018Seasonal windows as testable entry and abstention rules
- 2019Calendar rotation of seasonal and regime questions
- 2020Constructing calendar interval votes for cycle workbooks