2014issue C0938-42
Seasonal cycles as a regime overlay
The archive treats a six-month seasonal switch as a two-sided allocation and reads May as an average high or an earlier agrarian inflow, not as an annual sell command. Editorial reading: pair that regime context with a long cycle lookback and with testable entry, exit, and abstention rules.
- A six-month seasonal switch is a two-sided allocation process rather than a one-sided summer exit.
- The shortest lookback treated as valid for market cycles is about 21 years, and cycle use is combined with contemporaneous fundamentals, technicals, and trader-specific indicators.
- May is described as an agrarian inflow regime in an early Dow sample and later as an average seasonal high, not as a rule that prices decline every May.
- Entry, exit, and abstention belong in one testable procedure so a calendar tendency is never applied as a standalone signal.
A calendar is context, not an order
Editorial reading: seasonality is most useful as a regime overlay. It places a single trade in a broader market context rather than issuing a date-based command to buy or sell.
The archive presents a six-month seasonal switching procedure as a two-sided allocation process rather than a one-sided summer exit.
Editorial combination: that seasonal context is joined to a long-lookback cycle baseline and to entry, exit, and abstention rules that can be tested as one procedure.
Two-sided seasonal allocation
The six-month seasonal switching procedure is presented as a two-sided allocation process. It is not framed as a one-sided instruction to exit for the summer.
The same frame across markets
The same seasonal and cycle framework is applied across equity indexes, sector vehicles, and individual stocks. It is also applied to a multi-segment commodity calendar that includes index futures, rates, four major currencies, energy, metals, grains, softs, and livestock.
What a May tendency describes
A one-year Dow seasonal pattern from 1901 to 1949 is described as a May inflow regime associated with an agrarian cash-flow calendar rather than a May peak.
The later May tendency is framed as an average seasonal high. It is not framed as a rule that prices decline in May every year.
A midterm-year overlay
A midterm-year overlay is used to interpret summer 2014 strength as a second-term midterm regime. That second-term midterm regime is typically stronger than a first midterm year.
A typical-day half-hour profile
A typical-day half-hour profile is reported to persist after decimalization and high-frequency trading. The profile shows opening weakness, strength in the next half hour, midday and 2:00 to 2:30 pullbacks, then a 3:00 to 4:00 upward bias.
A long lookback for market cycles
The shortest lookback treated as valid for identifying market cycles is about 21 years. That span is chosen as an odd length longer than one secular bull or bear and usually covering two such regimes.
Dominant-cycle detection compares an explicit quantitative baseline with an out-of-sample result from ordered price, volume, or breadth observations over a defined sampling interval and lookback.
Seasonality plus contemporaneous evidence
Cycle use is specified as a combination of seasonality with contemporaneous fundamentals, technicals, and trader-specific indicators rather than as a stand-alone calendar command.
Seasonal analysis places a single trade in a diversified or regime-aware market context using cross-market prices, volatility, carry, and portfolio weights over weeks to months. Seasonal trading then makes entry, exit, and abstention rules testable as one procedure from rule inputs, market state, and execution constraints over the system holding period.
A working accuracy frame
A working accuracy framing is given as being correct about 60 percent of the time and cutting losses short on the remaining 40 percent.
Dow Jones Industrial Average from 2009 through 2025
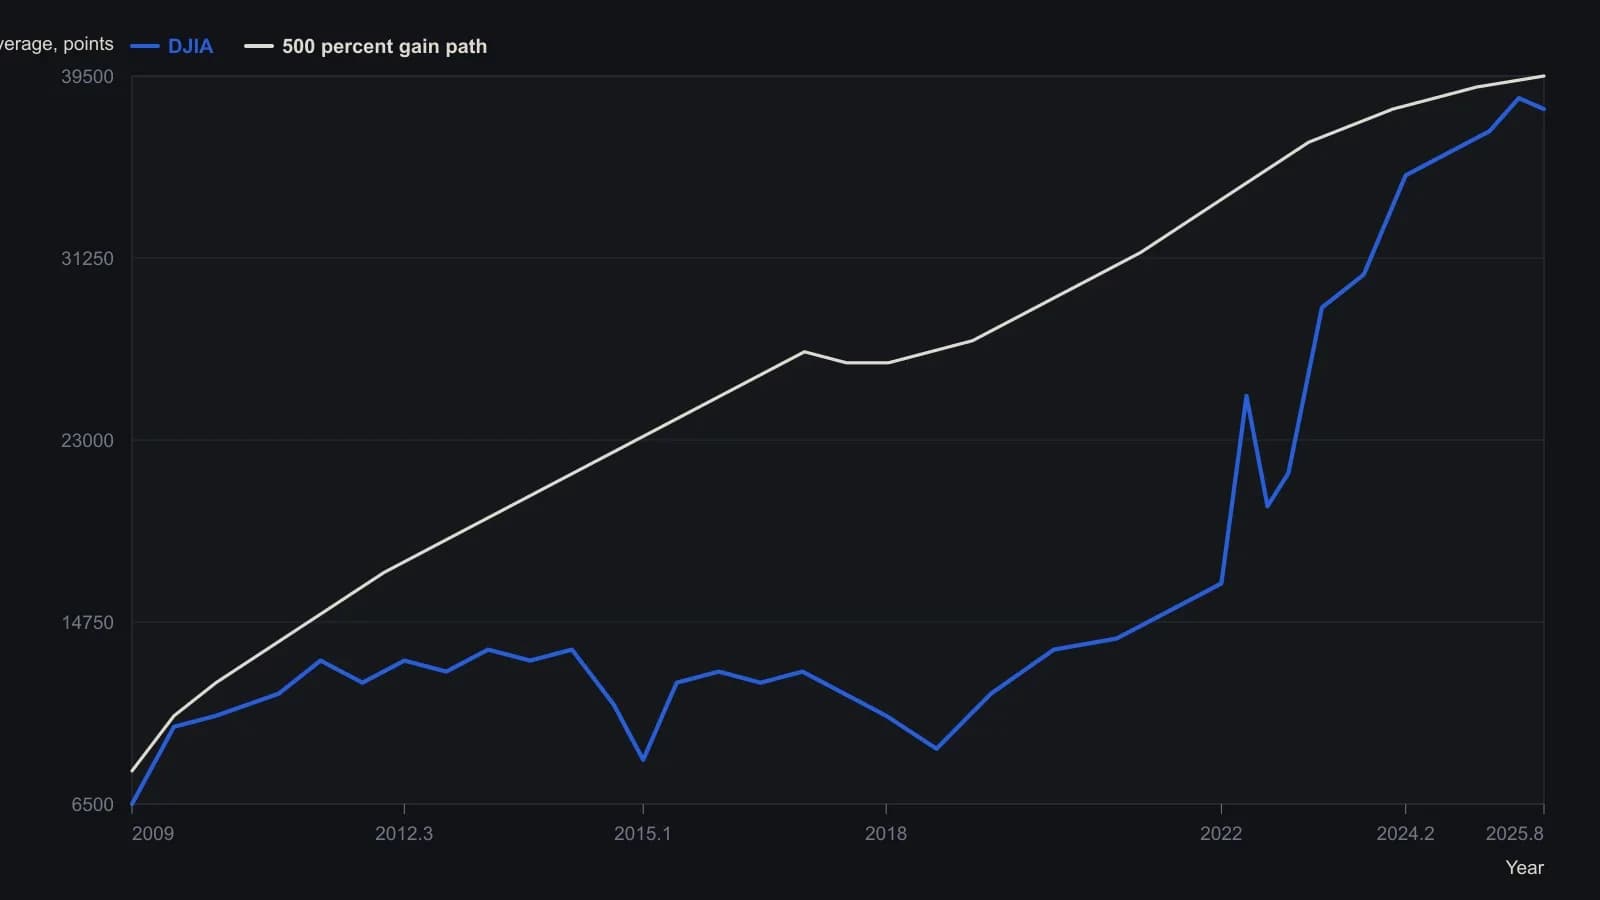
The jagged series is actual only through 27 May 2011. The path after that date, and the smooth 500 percent curve, are the Super Boom forecast from the 2011 book, not later prints. Levels are approximate to the nearest few hundred points.
All readings on this track · 21 readings
- 1986Two gates for setup and operator readiness
- 1990Time-only cycle dates in a Treasury bond case study
- 1990Constant-dollar regimes, the value line, and nested cycles
- 1992The four-year election cycle as an equity regime map
- 1992A semiconductor seasonal-index before the relative-strength overlay
- 1992Lock the holiday window as a regime, then veto resistance
- 1995Regime-aware stock screening with intermarket context
- 1996Standard-error bands, width gates, and weekday counts
- 1999Constructing seasonal factors from centered moving averages
- 2000Seasonal window, then weekly breadth
- 2004Copper as a regime map for cycles and recessions
- 2008Election-cycle windows as a mechanical seasonal system
- 2012A 2012 case study in Kondratieff-wave and presidential-cycle overlays
- 2012The October to May window as a mechanical portfolio procedure
- 2013Half-year seasonality as an equity regime overlay
- 2014Seasonal cycles as a regime overlay
- 2015Seasonal oil window as a defined-risk spread case
- 2017Calendar regimes, RSI events, and sector rotation rules
- 2018Seasonal windows as testable entry and abstention rules
- 2019Calendar rotation of seasonal and regime questions
- 2020Constructing calendar interval votes for cycle workbooks