2006issue C061-2
Aligning sugar boom phases with seasonal analogs
Historical sugar work lined up completed boom-bust cycles on a shared day count. This editorial piece shows how to confirm only a printed first-upmove and a late-winter pullback band, while leaving an unmatched second-upmove as a phase-overlay rather than a realized regime.
- A dominant-cycle is recovered by lining up successive boom-bust episodes on a shared day count instead of calendar years.
- Confirm only phases already printed, especially first-upmove duration and a recurring late-winter correction band.
- Keep an unmatched second-upmove labeled as a historical-analog-comparison overlay, not as a realized regime.
- Seasonal-analysis asks whether a mid-boom pullback occupies the same calendar window seen in earlier cycles.
What the archive lined up
Benchmark sugar prices were shown as completed boom-bust cycles, with a later advance aligned against those earlier paths. When the completed cycles were superimposed, each rise and each decline occupied similar spans on a shared day count. Percentage paths for successive boom windows were plotted together to compare phase timing. The archive used a phase-overlay so successive cycles shared one time axis and rise, pause, and decline intervals could be compared.
NYBOT sugar boom-bust cycles overlaid on a shared day count
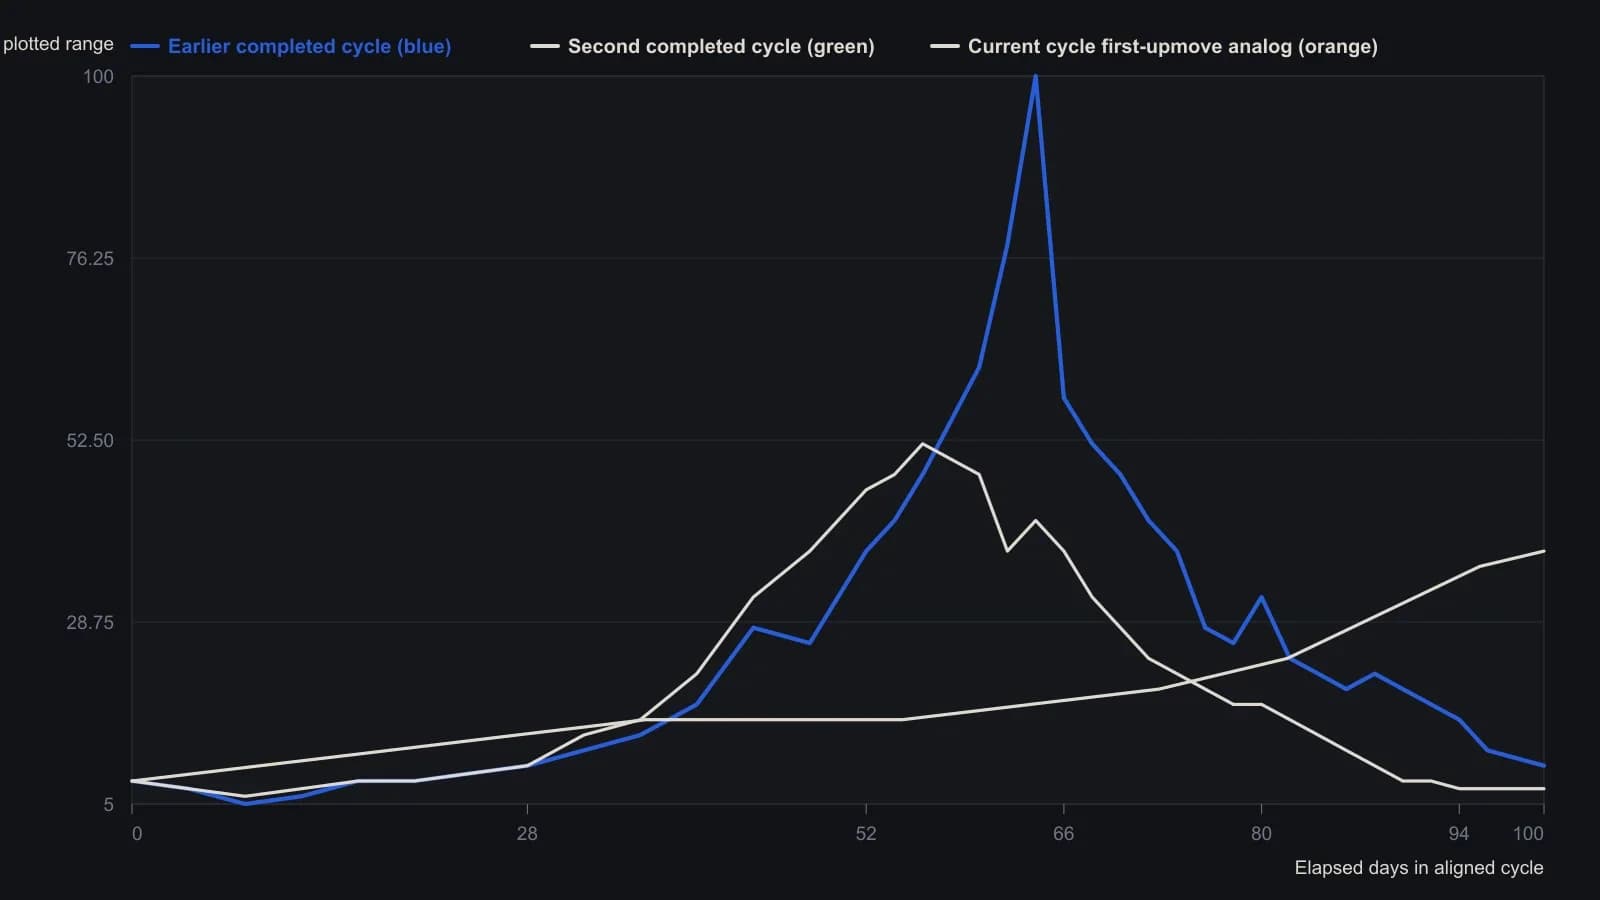
Digitized from the superimposed cycle chart. Y-values are approximate percent-of-cycle-range readings (0–100), not cents per pound; the source print does not label the overlay axis in the extracted text. Orange series ends mid-cycle at the first-upmove analog. No more than 60 points; raster precision is coarse.
Confirm the printed first-upmove
Dated first-upmove starts were recorded for each boom window. First-upmove peaks were then marked after closely similar day counts, and each opening advance was large in percentage terms. Those printed spans recover a dominant-cycle: a repeated rise-and-fall interval read from a shared day count rather than from calendar years. As an editorial matter, a later advance belongs on the map only to the extent its first-upmove has already printed a comparable duration.
Read the late-winter pullback as a seasonal slot
Mid-cycle pullbacks in the completed episodes were measured as sharp percentage drops over a few weeks. A later window was marked on a similar scale. Late-winter corrections in the earlier cycles, spanning February to March, averaged a large drop from the local high and were described as a substantial share of the first-upmove. That scale was mapped to a cents-per-pound zone beside a breakout-reference. Seasonal-analysis compares that same calendar window across cycles to judge whether a mid-boom pullback is occupying a familiar seasonal slot. This editorial reading treats the recurring late-winter band as a printed phase that can be confirmed, not as a forecast of the next move.
Leave the unmatched second-upmove as a projection
Second-upmove lengths were recorded in the completed cycles. The unmatched later analog was entered as a day-count projection. A historical-analog-comparison uses a completed earlier cycle as a duration and phase template for a later advance, and it keeps unmatched later phases as projections. Editorial interpretation: that second-upmove path is a phase-overlay, not a realized regime, until the later series prints a matching advance from the mid-cycle low to a later peak.
All readings on this track · 19 readings
- 1988Crash fear fails the depression regime test
- 1990October 1987 cycle overlay and the loss-trap
- 1990Constructing nested four-year market cycles
- 1991Evaluating quarterly return runs with historical analogs
- 1992Evaluating split events across correction and bear regimes
- 1993Mining-bullion relative strength as a gold-sleeve regime
- 1994A two-horizon case study of a market-breadth oscillator
- 1994Extreme short-rate declines as equity regime context
- 1997Clustered true-range days as a regime label rather than a top forecast
- 2001Nearest-neighbor one-week forecast from log-price patterns
- 2001Constructing nearest-neighbor forecasts gated by a trend filter
- 2003Regime context for debt-era bear rallies
- 2004Testing a 1987 stock and gold analog by wave degree
- 2004Shifting calendar regimes and election-cycle analogs
- 2006Aligning sugar boom phases with seasonal analogs
- 2009Crowd consensus and failed targets as regime context
- 2011Treat a long-horizon chart analog as a regime scenario
- 2012Build a weekly analog as a dated forecast object
- 2015From a drawn price shape to an event-cloud case study