1992issue C031-2
The four-year election cycle as an equity regime map
The archive averaged monthly percent changes in a major U.S. industrial equity average by month inside a four-year presidential term to form a cycle-path. Editorial reading: use that presidential-cycle as a regime overlay, then apply seasonal-trading to test whether entry, exit, or sit-out rules may fire in the window.
- Seasonal-analysis here averages monthly percent changes in a major U.S. industrial equity average by month inside a four-year presidential term, so one trade can be judged inside a broader market regime.
- The cycle-path starts on December 1 after a presidential election, accumulates through the next election year, and was described as quiet through most of the second year after an early advance.
- On the averaged path, a stronger stretch was described from a late-year advance in the second year, then a flattening, then a turn higher from June of the election year through the election and the January that follows.
- Editorial reading: treat the presidential-cycle as a regime overlay first, then use seasonal-trading as one procedure for whether entry, exit, or sit-out rules may fire in that window, including the election-year-window.
Building the cycle-path
Monthly percent changes in a major U.S. industrial equity average were computed from 1898 forward and then averaged by month inside a four-year presidential term. Seasonal-analysis, in this setting, is averaging monthly price changes by position in a repeating multi-year calendar so one trade can be judged inside a broader market regime.
The cycle-path is the cumulative average of those monthly percent changes. It was aligned to start on December 1 after a presidential election and then accumulate through the next election year. In this editorial reading, the presidential-cycle is that four-year U.S. election calendar used as a market-regime overlay rather than as a forecast of the next move.
Segments on the averaged path
After an advance at the start of the cycle, average monthly changes were characterized as quiet through most of the second year of the term. A late-year advance in the second year was described as the start of a stronger averaged stretch that later flattened through the following autumn, winter, and spring.
The averaged path was described as turning higher again from June of the election year through the election and the January that follows. After a pause, the averaged path was described as continuing higher through August of the year after the election.
The accompanying figure was described as showing that, on average in an election year, the advance begins in June. This article calls that stretch from mid-election-year into the following winter the election-year-window: one regime segment on the averaged path.
DJIA four-year presidential cycle path
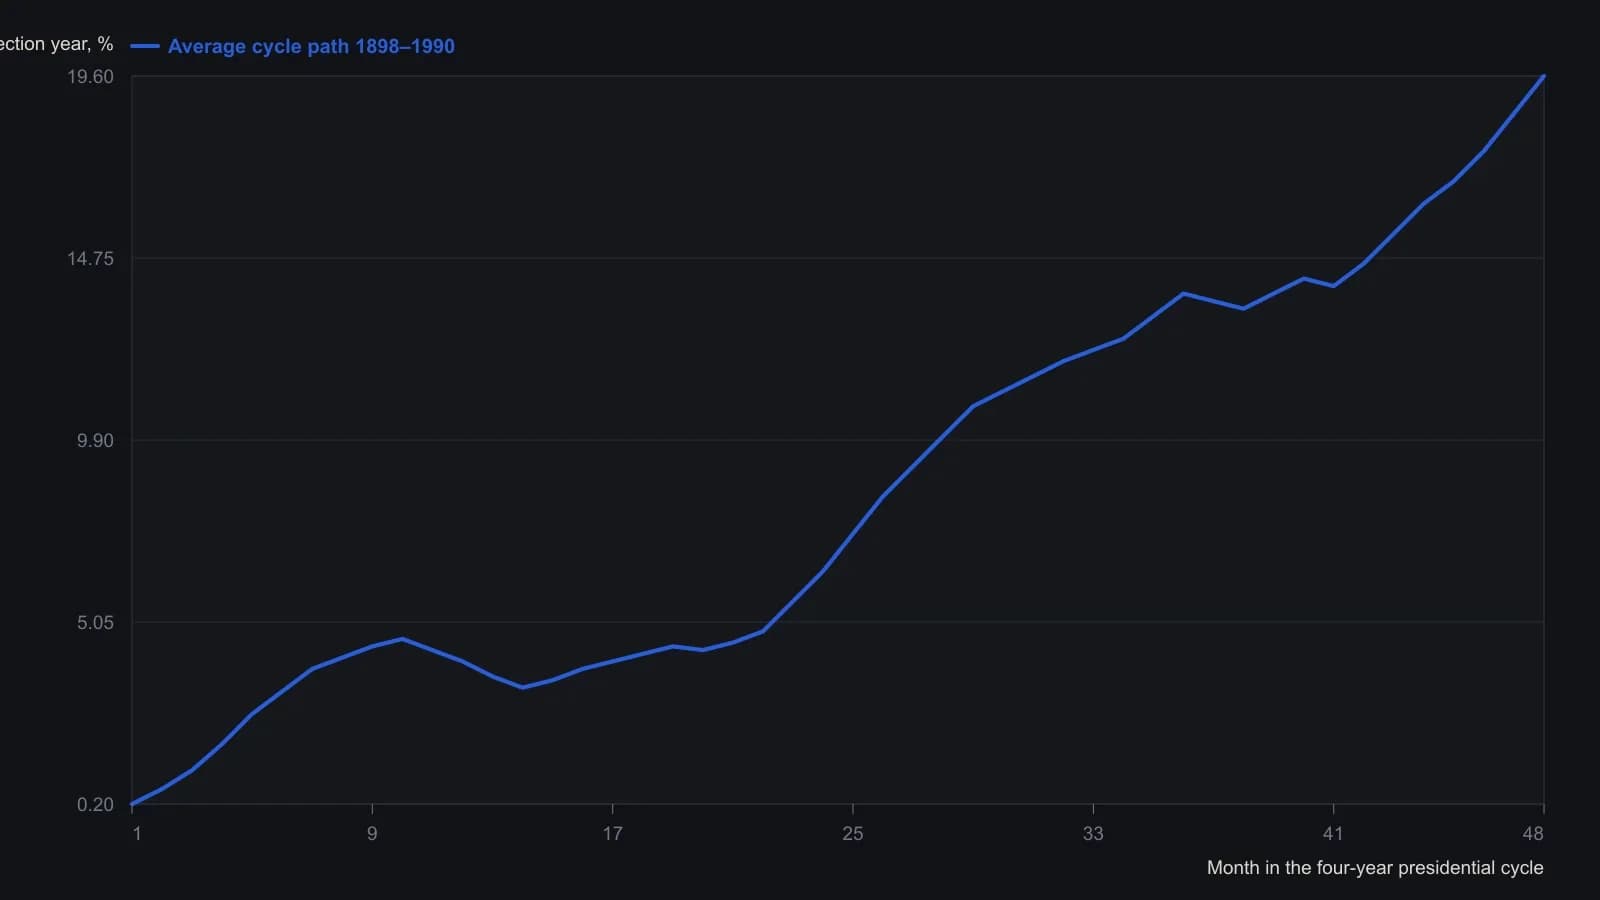
Merrill averaged month-by-month DJIA percent changes since 1898, then cumulated those averages from the December after an election through the next election year. Digitized from the plotted curve; monthly points are approximate.
Placing a trade on the map
Editorial reading: treat the four-year election calendar as a regime overlay first. Place a planned trade on the cycle-path, then test whether the system’s entry, exit, or sit-out rules should be allowed to fire in that window.
Seasonal-trading is the conversion of that calendar map into one testable procedure for entering, exiting, or standing aside. The archive presents the averaged path. Asking whether those rules may fire inside a segment such as the election-year-window is an editorial use of the map, not a claim made by the archive.
All readings on this track · 21 readings
- 1986Two gates for setup and operator readiness
- 1990Time-only cycle dates in a Treasury bond case study
- 1990Constant-dollar regimes, the value line, and nested cycles
- 1992The four-year election cycle as an equity regime map
- 1992A semiconductor seasonal-index before the relative-strength overlay
- 1992Lock the holiday window as a regime, then veto resistance
- 1995Regime-aware stock screening with intermarket context
- 1996Standard-error bands, width gates, and weekday counts
- 1999Constructing seasonal factors from centered moving averages
- 2000Seasonal window, then weekly breadth
- 2004Copper as a regime map for cycles and recessions
- 2008Election-cycle windows as a mechanical seasonal system
- 2012A 2012 case study in Kondratieff-wave and presidential-cycle overlays
- 2012The October to May window as a mechanical portfolio procedure
- 2013Half-year seasonality as an equity regime overlay
- 2014Seasonal cycles as a regime overlay
- 2015Seasonal oil window as a defined-risk spread case
- 2017Calendar regimes, RSI events, and sector rotation rules
- 2018Seasonal windows as testable entry and abstention rules
- 2019Calendar rotation of seasonal and regime questions
- 2020Constructing calendar interval votes for cycle workbooks