2001issue C071-5
Constructing a variable-interval average from a difference-oscillator or volatility forecast
A variable-interval average is built by scaling a ladder of close-to-close differences into a difference-oscillator, then using a length-map to set the period of an ordinary simple average. The same lookback band can be selected from a volatility forecast instead.
- A variable-interval average computes, on each bar, a recommended simple-average length from close-to-close difference intervals, a history window used for high-low scaling, and a pair of shortest and longest allowed lengths.
- Each interval change is min-max scaled and summed into a difference-oscillator, which is scaled again and sent through a length-map onto an integer lookback.
- The plotted Adaptive moving average is an ordinary simple average of closes at that bar-by-bar period, so lookback can change from one bar to the next.
- The same variable-length average can be driven by a Volatility forecast inside a 10-to-50 band, and any ranged indicator can serve as the period controller.
What a variable-interval average is
A variable-interval average is a simple average whose lookback is remapped on each bar from a scaled oscillator or volatility reading.
It is constructed by computing, on each bar, a recommended simple-average length from a set of close-to-close difference intervals, a history window used for high-low scaling, and a pair of shortest and longest allowed lengths.
Building the difference-oscillator
For each difference interval, the current close-to-close change is min-max scaled against the highest and lowest such changes over the history window. Those scaled readings are summed into one oscillator.
That summed, range-normalized series is the difference-oscillator: close-to-close changes computed over a ladder of intervals. The difference-oscillator is then min-max scaled over the same history window, which produces a zero-to-one scaled score.
The length-map and the plotted average
A length-map is the linear conversion of that zero-to-one scaled score onto a shortest-to-longest lookback band. The scaled oscillator is mapped onto the integer span between the shortest and longest allowed lengths, which becomes the current moving-average period.
The plotted Adaptive moving average is an ordinary simple average of closes evaluated at that bar-by-bar period, so the smoother's lookback can change from one bar to the next. That plotted series is a Moving average whose lookback is supplied by the length-map rather than held fixed.
A full ladder and a compact variant
One complete construction uses close-to-close differences over intervals from 2 through 35, places each difference inside a 250-bar high-low window, and converts the summed oscillator into a simple-average length.
A compact variant samples those intervals from 2 to 35 in steps of 3, sums the twelve scaled readings, and maps the oscillator's 250-bar range onto a simple-average length between 10 and 50.
A volatility forecast as the period controller
The same variable-length average can be driven by a Volatility forecast. A 21-bar volatility series is compared with its own high-low range and used to select a moving-average period inside a 10-to-50 band.
Any ranged indicator, not only volatility, can serve as the period controller, including a custom series or any of more than 80 predefined series.
Default inputs for the length function
Default published inputs for the length function are a maximum difference interval of 3, a 20-bar history window, and bracketing lengths of 3 and 6. Those inputs can be edited when the indicator is applied or passed into a strategy for systematic search.
Volatility-mapped average on daily Microsoft, February–May 2001
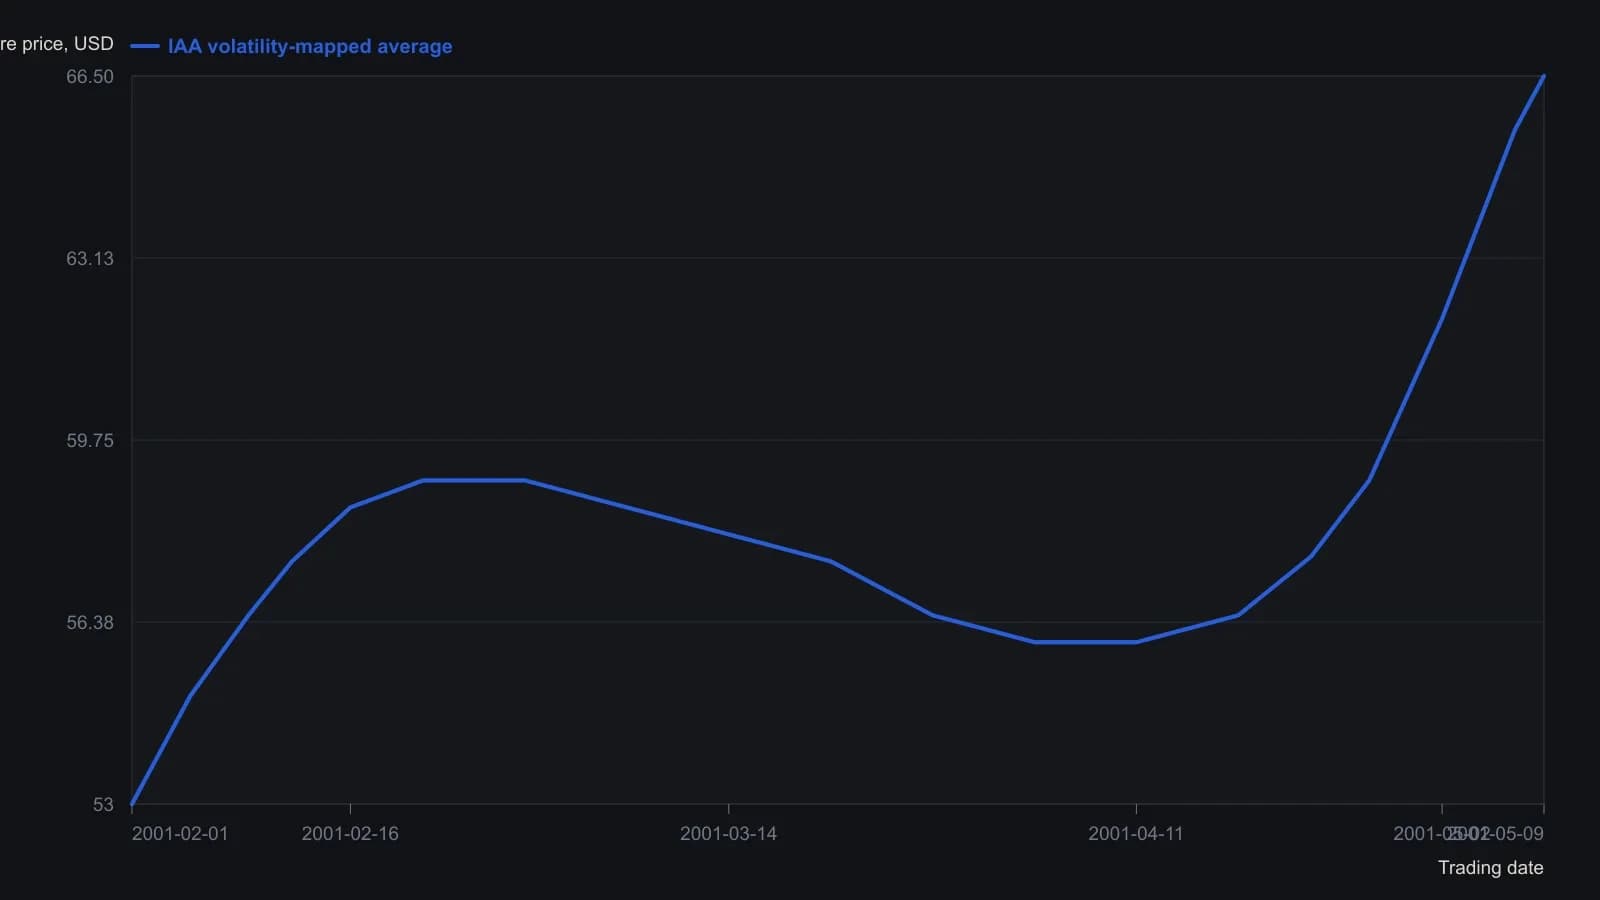
Investor/RT Indicator Adjusted Average with annualized 21-bar extreme-value volatility as the length controller, mapped onto a 10–50 day window of the close. Unmarked readings are only good to about half a dollar because they come from a magazine screenshot.
All readings on this track · 6 readings
- 1994Constructing hourly index futures lattices from live volatility
- 1995A short-to-long historical-volatility ratio as a regime-gate
- 2001Constructing a variable-interval average from a difference-oscillator or volatility forecast
- 2006Percent-scale average true range for comparable range
- 2007Historical compression and implied slope as a futures regime map
- 2013GARCH and a volatility rank as market-regime classifiers