2017issue C038-13
Volatility parity equalizes the ticket; implied volatility is a regime dial
Using the same share count or a single futures contract on every trade lets higher-priced or more volatile markets dominate a multi-market book. Volatility parity lines up each ticket’s risk contribution. Historical volatility and implied volatility can travel together for years and still part in stress, so they are not the same sizing input.
- Using the same share count or a single futures contract on every trade lets higher-priced or more volatile markets dominate a multi-market book.
- Volatility parity sizes each trade so its volatility, and therefore its risk contribution, is brought into line with the others.
- Historical volatility is a lagging realized-price average; implied volatility can jump on news and fade when the news is empty.
- Unbounded average-true-range sizing can push exposure far above a fixed cash budget, and a fixed 100-share lot is not the same risk unit over a long sample.
Fixed lots let some markets dominate
Using the same share count or a single futures contract on every trade lets higher-priced or more volatile markets dominate a multi-market book. Volatility parity sizes each trade so its volatility, and therefore its risk contribution, is brought into line with the others. Each trade then has a more equal chance to affect results.
Under a volatility-based size rule, quieter markets get larger positions and more volatile markets get smaller ones.
Historical volatility lags; implied volatility jumps
Historical volatility is computed from realized prices and, in this account, uses a 20-day average that lags. Implied volatility is taken from options pricing and can jump on news then fade when the news is empty.
A long 2000 to 2016 comparison of the two volatility series looks broadly similar. The 2008 window shows realized volatility still rising after implied volatility has flattened.
Implied volatility flattened while historical volatility was still rising in 2008
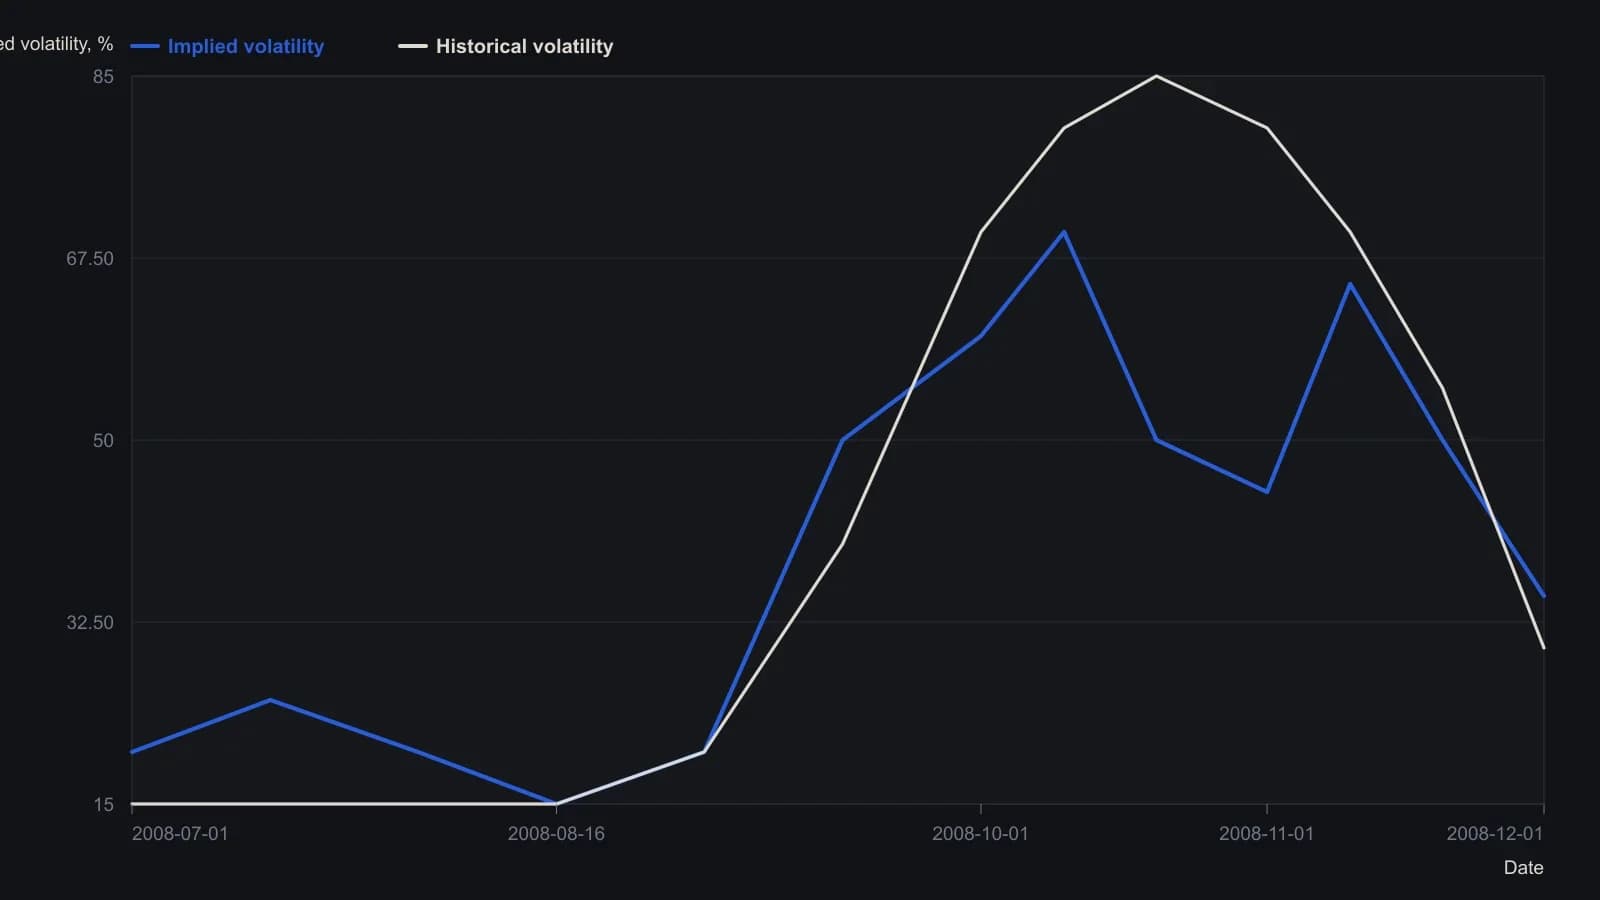
Kaufman measures historical volatility as a 20-day average of actual prices; implied volatility is the VIX. Readings are approximate to about five volatility points because they were taken from the published raster.
Five size rules on the same timing
Five sizing rules were applied to the same 120-day moving-average timing on a broad equity exchange-traded fund: a fixed 100-share lot, a 100-share lot capped at 10,000 of exposure, a constant 10,000 exposure divided by price, unbounded average-true-range size, and size scaled by one minus implied volatility.
A fixed 100-share rule lets later higher-priced years weigh more than earlier lower-priced years unless a cash cap is applied. Uncapped lot size is not the same risk unit over a long sample.
Price-based sizing keeps each trade at a fixed dollar exposure by dividing that budget by the current price. Names priced under 5 produce rapidly expanding share counts and more erratic volatility.
Unbounded average-true-range sizing equalizes risk trade by trade. Average true range is a price-range measure that includes gaps from the prior close. Because the rule expands sharply when volatility is low, it can push exposure far above a fixed cash budget.
Inverse implied-volatility sizing of the form 100 minus the volatility index, floored at zero, cuts size when implied volatility is high and goes to zero if the index is above 100. The same account notes the index averaged about 21 and usually lived between 13 and 30.
How large and how small the adjustment should be
The remaining design question is how large and how small those volatility adjustments should be.
Editorial reading: answer that question at the ticket with Volatility position sizing, so the loss or exposure decision is bounded before entry. Keep implied volatility on the separate Volatility targeting dial so the book stays stress-aware.
All readings on this track · 25 readings
- 1988Two-sided optimization for volatility-scaled breakout rules
- 1990Weekly range volatility as a tactical regime filter
- 1993Heat first, then contract count on a weekly close-only breakout
- 1994Shared sigma for trend entries, retests and stops
- 1995The promised result as one testable trading procedure
- 2001Convert a survival ceiling into a volatility filter
- 2002Bound the next loss before the bear trade
- 2004Dollar-loss tolerance versus percent-of-equity stops
- 2004Bounded risk before entry: stop, size, and leverage
- 2006Position sizing as the pre-trade bound on loss and exposure
- 2006A trend-regime matrix for volatility position sizing
- 2011A premarket range checklist for opening-hour breakouts
- 2011Stop-defined share count on a clustered intraday short
- 2012Mechanical system design with strategy, signals, and size
- 2012Precommit size before a one-day policy shock
- 2013R-multiple expectancy, drawdown, and volatility position sizing
- 2014Constructing trend-aware slope-divergence rules
- 2014Pretrade drawdown fences and volatility sizing
- 2015Convert pip value into cash before a forex lot size is chosen
- 2016Expectancy as an execution skill rather than a backtest score
- 2017Volatility parity equalizes the ticket; implied volatility is a regime dial
- 2018Wide-range breakout rules from chart volatility
- 2019A structure-based stop, then resize or pass
- 2020A cash rule that zeros a trend book on extreme volatility and a short losing window
- 2025R-multiples before you size up