2013issue C0228-35
R-multiple expectancy, drawdown, and volatility position sizing
Historical r-multiples supply expectancy and a spread that define a minimum R-curve. A live path that falls through the lower bound can be treated as a broken-system filter, while position size is scaled from equity so a one-R stop stays inside a chosen risk fraction and a drawdown budget.
- R is the dollar amount at risk from entry, stop, and position size. Holding R constant in dollars or as a fraction of equity makes later results comparable in risk units.
- Mean R (expectancy) and the standard deviation of historical r-multiples are the two inputs for a minimum acceptable performance curve and for a straw-broom of resampled cumulative-R paths.
- A live path that falls through the lower confidence bound on cumulative R can be treated as a broken-system filter. The same construction supplies a drawdown limit that can be checked before entry and during an open book of trades.
- Once a risk fraction is chosen, position size is scaled from current equity so a one-R stop stays inside that fraction. Market-money and compression-expansion change how aggressively the next trade is sized.
R as a common risk unit
R is the dollar amount at risk on a trade, computed from entry, stop, and position size. Keeping R a constant dollar amount or a constant fraction of equity makes later performance comparable in risk units.
An r-multiple is a closed trade's profit or loss expressed as a multiple of the dollars placed at risk on that trade.
Expectancy from a set of r-multiples
From a set of historical r-multiples a trader can compute mean R (expectancy) and the standard deviation of R, then use those two statistics as the inputs for a minimum acceptable performance curve. Expectancy is the mean r-multiple of a strategy's historical trade set: the average return in risk units per trade.
A worked r-multiple sample has mean 0.370, median -1.000, win ratio 0.397, and standard deviation 2.806. The sample shows positive expectancy with a losing-trade majority and a fat right tail.
A straw-broom of cumulative R
Resampling the r-multiple set into many long Monte Carlo paths produces a straw-broom of cumulative R. A straw-broom is a family of those resampled equity paths, used to sketch the likely spread of future cumulative R. The center of the broom tracks mean R times trade count, and the width is governed by the R standard deviation.
Lower and upper confidence bounds on cumulative R after n trades are given by LL = [μ − (z · σ / √n)] · n and UL = [μ + (z · σ / √n)] · n. A live equity path that falls through the lower bound can be treated as a broken-system filter.
Drawdown limit before entry and in an open book
The same lower-bound construction also supplies a worst-case drawdown envelope and a maximum breakeven trade count. Together they act as a drawdown limit that can be checked before entry and during an open book of trades.
A drawdown limit is a pre-agreed floor on cumulative R or equity. Below that floor the strategy is treated as broken and risk is reduced or trading stops.
Volatility position sizing from equity and stop distance
Once a risk fraction is chosen, position size is scaled from current equity so that a one-R stop loss stays inside that fraction. Volatility position sizing sizes each position from account equity, current volatility, and the stop distance so the loss if the stop is hit stays inside a planned fraction of equity.
Using market-money as a separate risk pool changes how aggressively the next trade is sized. Market-money is the surplus of current equity over starting equity, treated as a pool that can be risked more aggressively than original capital.
A 50 percent compression factor on the downside and a matching expansion factor on the upside means the next trade risks more than simple proportional sizing after a rise and less after a decline. Compression-expansion shrinks risk after a drawdown and enlarges risk after an equity rise, typically by a fixed fraction of the gap from a reference equity. This is a volatility-and-equity position-sizing rule rather than a signal rule.
Minimum expected cumulative R over 1,000 trades
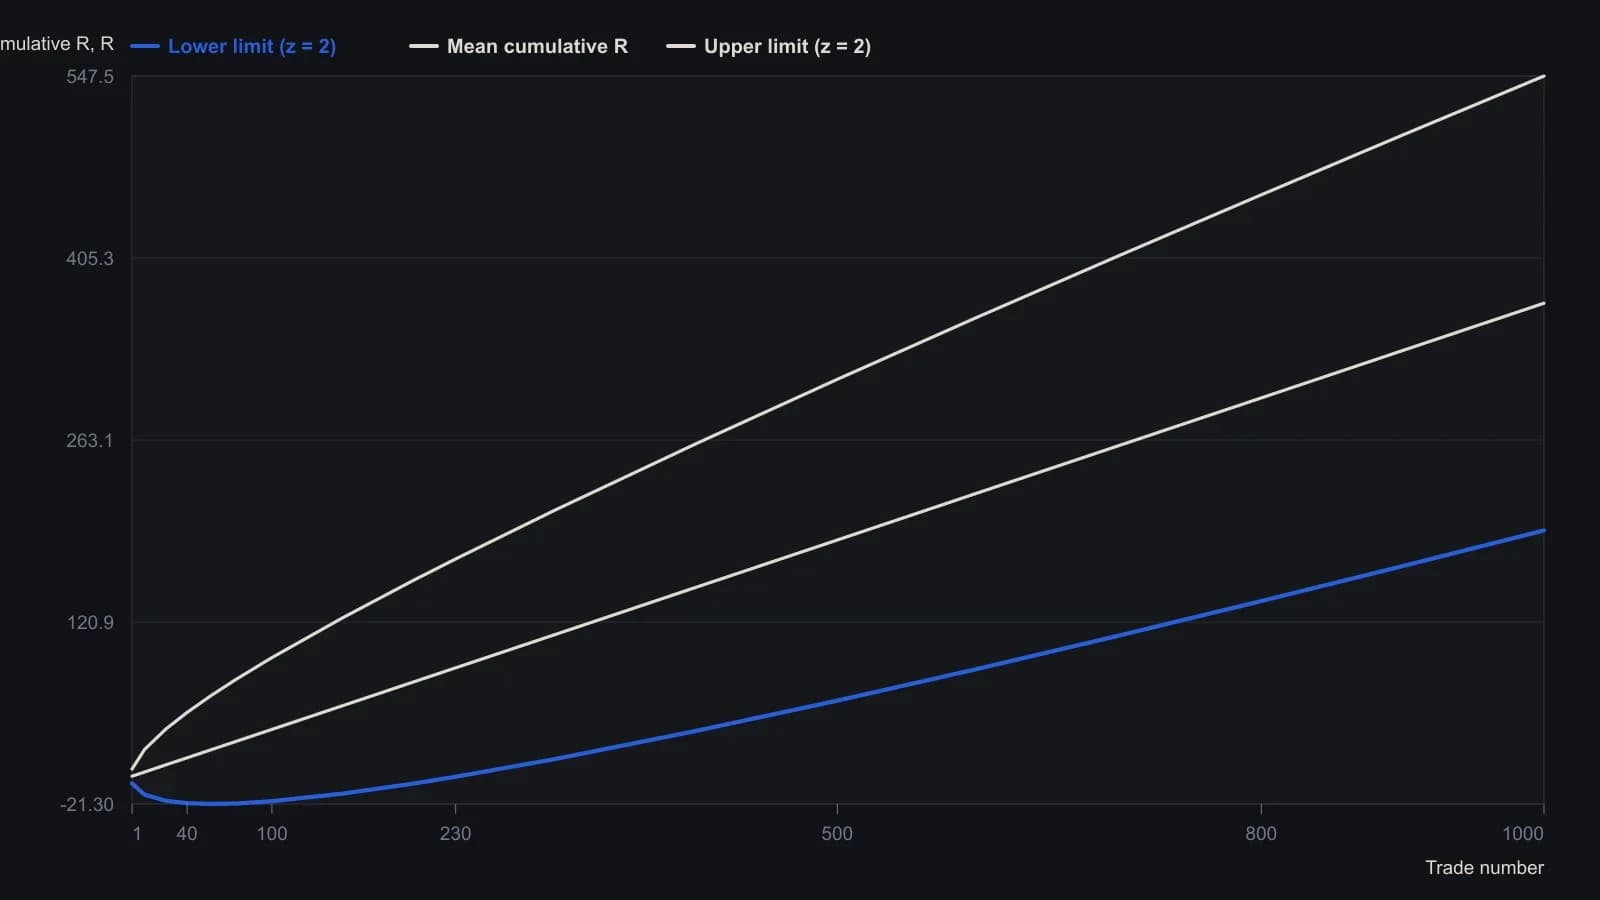
LL = n·μ − z·σ·√n and UL = n·μ + z·σ·√n with z = 2. Lowest-equity point is −21.28 R near trade 57; the lower curve recrosses zero near trade 230 (TWR at trade 1,000 is 192.5 R). The n = 1 value is the raw formula; the source notes that the Monte Carlo broom actually has zero spread at the first trade.
All readings on this track · 25 readings
- 1988Two-sided optimization for volatility-scaled breakout rules
- 1990Weekly range volatility as a tactical regime filter
- 1993Heat first, then contract count on a weekly close-only breakout
- 1994Shared sigma for trend entries, retests and stops
- 1995The promised result as one testable trading procedure
- 2001Convert a survival ceiling into a volatility filter
- 2002Bound the next loss before the bear trade
- 2004Dollar-loss tolerance versus percent-of-equity stops
- 2004Bounded risk before entry: stop, size, and leverage
- 2006Position sizing as the pre-trade bound on loss and exposure
- 2006A trend-regime matrix for volatility position sizing
- 2011A premarket range checklist for opening-hour breakouts
- 2011Stop-defined share count on a clustered intraday short
- 2012Mechanical system design with strategy, signals, and size
- 2012Precommit size before a one-day policy shock
- 2013R-multiple expectancy, drawdown, and volatility position sizing
- 2014Constructing trend-aware slope-divergence rules
- 2014Pretrade drawdown fences and volatility sizing
- 2015Convert pip value into cash before a forex lot size is chosen
- 2016Expectancy as an execution skill rather than a backtest score
- 2017Volatility parity equalizes the ticket; implied volatility is a regime dial
- 2018Wide-range breakout rules from chart volatility
- 2019A structure-based stop, then resize or pass
- 2020A cash rule that zeros a trend book on extreme volatility and a short losing window
- 2025R-multiples before you size up