2020issue C0622-25
A cash rule that zeros a trend book on extreme volatility and a short losing window
When a trend-following book's own realized-return volatility is extreme and a three-day net return is negative, one historical overlay exits every position to cash. Reentry waits until volatility eases and that short window turns positive. The trigger is the trading book, not the market, and the move to cash is recorded as a reaction rather than a forecast.
- Price shocks share two traits: extremely high volatility and prices moving against the positions that are held.
- The cash trigger uses the trading book's own returns and volatility, not the market's, because a trend-following book that is already short can still be profitable while prices fall.
- An example rule exits all positions when strategy volatility is over 30 percent and three-day net returns are negative, and it reenters only when volatility is under 30 percent and those three-day returns are positive.
- Historic volatility of realized returns is treated as a smoother, lagged measure than options-implied volatility, which is described as often higher and more spike-prone.
What the overlay does
This archive article records a stay-in or go-to-cash overlay on a trend-following book. The book remains one procedure that turns rule inputs, market state, and execution constraints into entry, exit, and abstention over the system holding period.
The overlay is a bound on loss and exposure that uses account equity, realized return volatility, a stated extreme threshold, and a stay-in or go-to-cash decision made before entry and while the position is open. A trend filter reads ordered return or volatility observations over a fixed lookback and sampling interval to decide whether the baseline trend signal remains eligible.
Price shocks and historical episodes
A price shock is an abrupt or building adverse move marked by extremely high volatility and prices traveling against held positions.
In the illustrated late-1990s and 2008 episodes, volatility spikes lined up with the worst of the decline. In the 2008 case, volatility stayed above 35 percent until a recovery was already underway.
A rapid late-2018 drop lifted volatility from very low levels through 15 percent and 24 percent to 30 percent. An exit at the high-volatility point would have missed the start of a rebound of almost 20 percent.
When an outcome is concentrated on a single scheduled day, historic volatility may show only modest anticipation. That leaves little room to protect after the surprise prints.
Nasdaq futures through the 2000 bubble and crash
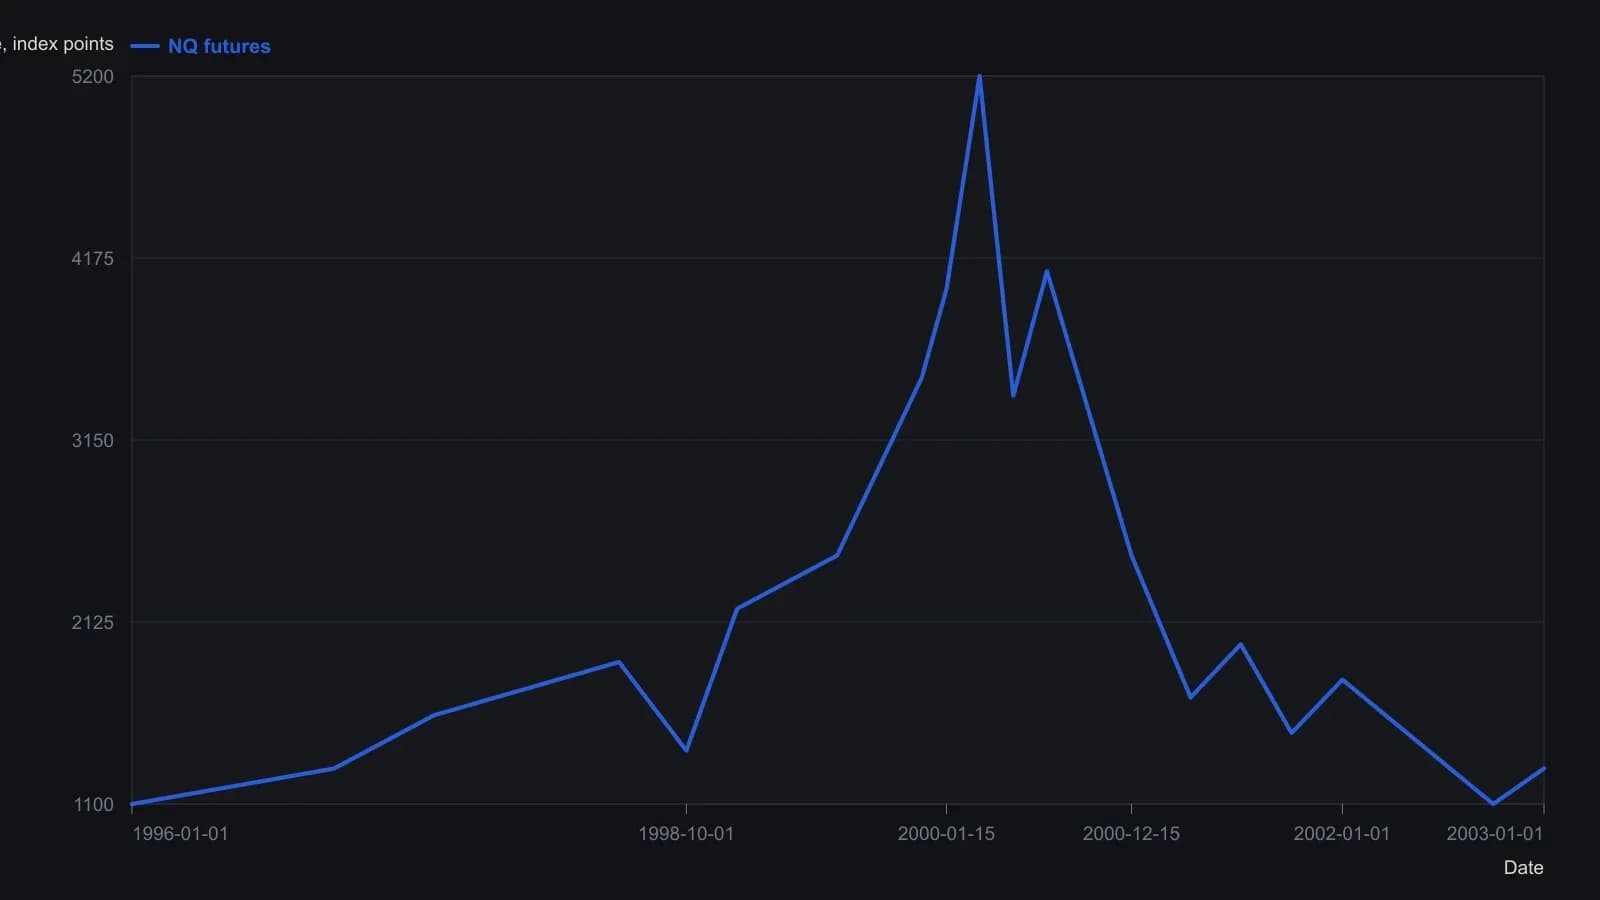
The source draws annualized volatility on a second axis. The article puts that series near 90% at the worst of the decline and at or below 20% once prices began to recover. It is omitted here because it does not share the futures-price scale.
Why the book's own series is the trigger
On 24 February 2020, a trend system's own return volatility exceeded 30 percent and recent net returns were negative. That pairing prompted a full exit to cash as a reaction rather than a forecast.
The relevant trigger is the trading book's own returns and volatility, not the market's returns. A trend-following book that is already short can still be profitable while prices fall and volatility rises.
Historic volatility as the working measure
Historic volatility of realized returns is treated as a smoother, lagged measure than implied volatility. Implied volatility is an options-based reading of trader anticipation, described as often higher and more spike-prone than what actually occurred.
The working procedure records daily returns as a percent of allocated capital, a three-day net return, and annualized volatility as the standard deviation of the last 20 daily returns times the square root of 252. The three-day net return is a short confirmation window paired with the volatility cutoff, so exit and reentry require both instability and the sign of recent results.
The example rule, a buffer, and a constant-exposure target
One example rule set exits all positions when strategy volatility is over 30 percent and three-day net returns are negative. It reenters when volatility is under 30 percent and those three-day returns are positive. The 30 percent figure is a strategy-specific extreme volatility threshold that separates ordinary fluctuation from a full risk-off state.
A buffer that exits above 30 percent and reenters below 25 percent is offered to stay in cash a few extra days and reduce rapid flip-flops. A separate constant-exposure target of 12 percent to 14 percent is presented as a way to keep day-to-day risk more stable outside crises.
All readings on this track · 25 readings
- 1988Two-sided optimization for volatility-scaled breakout rules
- 1990Weekly range volatility as a tactical regime filter
- 1993Heat first, then contract count on a weekly close-only breakout
- 1994Shared sigma for trend entries, retests and stops
- 1995The promised result as one testable trading procedure
- 2001Convert a survival ceiling into a volatility filter
- 2002Bound the next loss before the bear trade
- 2004Dollar-loss tolerance versus percent-of-equity stops
- 2004Bounded risk before entry: stop, size, and leverage
- 2006Position sizing as the pre-trade bound on loss and exposure
- 2006A trend-regime matrix for volatility position sizing
- 2011A premarket range checklist for opening-hour breakouts
- 2011Stop-defined share count on a clustered intraday short
- 2012Mechanical system design with strategy, signals, and size
- 2012Precommit size before a one-day policy shock
- 2013R-multiple expectancy, drawdown, and volatility position sizing
- 2014Constructing trend-aware slope-divergence rules
- 2014Pretrade drawdown fences and volatility sizing
- 2015Convert pip value into cash before a forex lot size is chosen
- 2016Expectancy as an execution skill rather than a backtest score
- 2017Volatility parity equalizes the ticket; implied volatility is a regime dial
- 2018Wide-range breakout rules from chart volatility
- 2019A structure-based stop, then resize or pass
- 2020A cash rule that zeros a trend book on extreme volatility and a short losing window
- 2025R-multiples before you size up