1994issue C101-12
Shared sigma for trend entries, retests and stops
The worked trend design uses one volatility unit to decide when a high or low is new, where the entry may sit, and how far the first protective stop may stand. Take, skip, confirm and abort then share a single written scale.
- A mechanical trading system is a written take-or-skip sequence that names the next order, states a risk bound and leaves a record that can be scored after the trade.
- Sigma, the 20-day average true range plus two standard deviations of that true range, qualifies a new extreme, marks a retest and sets the first protective stop before position size is chosen.
- Entry is a trailing stop after a 5-day stochastic leaves its extreme, then a confirmation-rule holds opposite signals until a higher low or lower high appears.
- Historical paper checks must include non-trending conditions, and a three-trade losing run was treated as a reason to retest rather than as a finished proof.
One written sequence
A mechanical trading system is a written take-or-skip procedure that names the next order, stays testable as one sequence, and does not wait on discretionary reinterpretation after the signal appears. A finished procedure is automatic, states a risk bound, names the next action, and leaves a record that can be scored after the trade.
Editorial: this article teaches that procedure as one shared volatility unit. The same sigma that decides whether a high or low is new also sets the entry band and the first loss bound, so take, skip, confirm and abort can be marked on a single scale before anyone argues about returns.
Take, skip, true and false
Signals are classed as take or skip and as true or false. A positive-signal is a rule-based instruction to enter or reverse, later scored true if the trade was warranted and false if it was not. A negative-signal is market action that produces no order; it is a true skip when standing aside was correct and a false skip when a trade should have been taken.
True-take outcomes must cover losses from false takes and from skipped trades that should have been taken.
One sigma for extremes, retests and the first stop
The worked trend design treats each minor-trend turn as a candidate secondary reversal and changes side with a reversing-stop after direction turns, rather than buying the retest with a limit. A reversing-stop flips the position only after price closes through the prior day's high or low.
A new high or low is counted only when the close clears the prior extreme by sigma. Sigma is a volatility unit equal to the 20-day average true range plus two standard deviations of that true range, used to define breakouts, retests, entry limits and the first protective stop. A close inside one sigma is treated as a retest.
Where the entry is placed
A 5-day stochastic locates the close in the recent range. After the smoothed reading leaves the 75 or 25 extreme, the entry is a trailing stop at the prior day's low or high, not the move into the extreme.
Confirmation and the second exit
Each new position carries a protective stop one sigma from entry. That stop-loss is a pre-placed exit that caps an unconfirmed entry at one volatility unit, with a separate trailing exit at the last reactionary swing when the market turns without a signal.
The confirmation-rule holds after a new position is opened: ignore opposite oscillator signals until a higher low or lower high confirms the trend, or until the protective stop is hit.
Size after the loss is bounded
Position size may stay fixed, profits may be withdrawn at a stated equity band, or contract count may rise with equity. Per-trade exposure is first bounded by the one-sigma stop and by a risk amount small enough that a full loss is acceptable.
How the paper record is judged
Historical paper checks come before live paper checks because a multi-year live sample is impractical. The chosen window must include non-trending conditions rather than only strong trends. Logged paper trades are judged from win and loss counts, consecutive runs, the equity path, calendar returns and drawdowns, and peak-to-valley moves, including whether a stated drawdown would halt use of the rules.
A 1991 to 1994 Treasury-bond walk-through was rejected as a valid check because the window was an unusually strong rally. A 1978 to 1992 soybean paper series with stated month-end rollovers was used instead. A longest losing run of only three trades was treated as a reason to retest on another market or with a mechanical tester.
June T-bond paper account after each closed trade
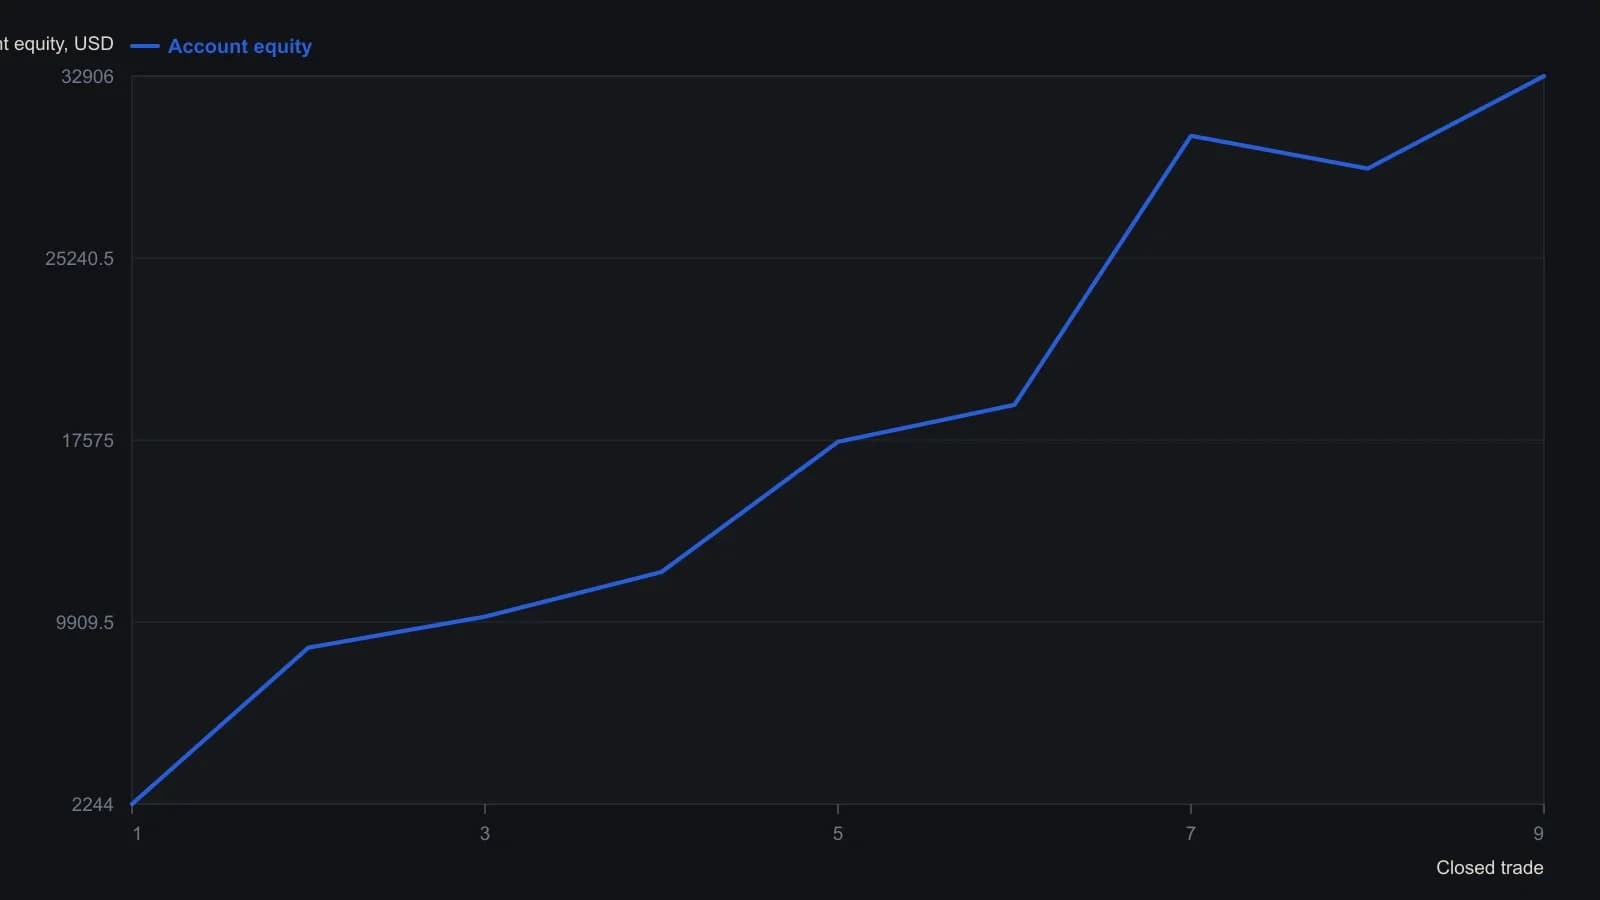
The summary row counts ten closed trades (eight winners, two losers). Nine running Account figures are readable in the scan; the missing intermediate total was not filled in.
All readings on this track · 25 readings
- 1988Two-sided optimization for volatility-scaled breakout rules
- 1990Weekly range volatility as a tactical regime filter
- 1993Heat first, then contract count on a weekly close-only breakout
- 1994Shared sigma for trend entries, retests and stops
- 1995The promised result as one testable trading procedure
- 2001Convert a survival ceiling into a volatility filter
- 2002Bound the next loss before the bear trade
- 2004Dollar-loss tolerance versus percent-of-equity stops
- 2004Bounded risk before entry: stop, size, and leverage
- 2006Position sizing as the pre-trade bound on loss and exposure
- 2006A trend-regime matrix for volatility position sizing
- 2011A premarket range checklist for opening-hour breakouts
- 2011Stop-defined share count on a clustered intraday short
- 2012Mechanical system design with strategy, signals, and size
- 2012Precommit size before a one-day policy shock
- 2013R-multiple expectancy, drawdown, and volatility position sizing
- 2014Constructing trend-aware slope-divergence rules
- 2014Pretrade drawdown fences and volatility sizing
- 2015Convert pip value into cash before a forex lot size is chosen
- 2016Expectancy as an execution skill rather than a backtest score
- 2017Volatility parity equalizes the ticket; implied volatility is a regime dial
- 2018Wide-range breakout rules from chart volatility
- 2019A structure-based stop, then resize or pass
- 2020A cash rule that zeros a trend book on extreme volatility and a short losing window
- 2025R-multiples before you size up