2014issue C0620-25
Constructing trend-aware slope-divergence rules
When price and momentum drift in opposite directions, the conflict can be written as opposite regression-slope signs, confirmed across several short windows, and resolved by following the existing price trend. Volatility bounds size before the order, and the exit plus time spent flat stay inside the same procedure.
- Write slope-divergence as opposite signs on same-length price and momentum slopes so entry does not wait on matched peaks and valleys.
- Use multi-window confirmation so a rule-based entry needs agreeing short windows and no opposing window.
- Apply trend-resolution by taking the prevailing price-slope direction through the pause, rather than fading price because momentum disagrees.
- Bound each order with volatility position sizing, then let aligned slopes and flat-time control close or withhold exposure.
Why visual divergence is hard to code
A technical divergence exists when an instrument's price and a momentum calculation on that price move in opposite directions. Classic chart use expects a later price move in the momentum direction.
Visual peak-and-valley matching is hard to complete in real time. The reading appears infrequently on daily bars, is noisier on intraday bars, and can be faint when volatility is low.
Encode the conflict as slope-divergence
Opposite signs on same-length linear-regression slopes of price and momentum, including a five-session window, can mark divergence without requiring aligned peaks or troughs. That state is slope-divergence: the signed linear-regression slope of price and the signed slope of a momentum series, measured over the same short window, point in opposite directions.
Momentum lookbacks are kept longer than the slope windows. Slope lengths are typically kept in a short band starting at five sessions, so the regression does not flatten and very short windows do not dominate.
SPY slow stochastic with three labeled divergences
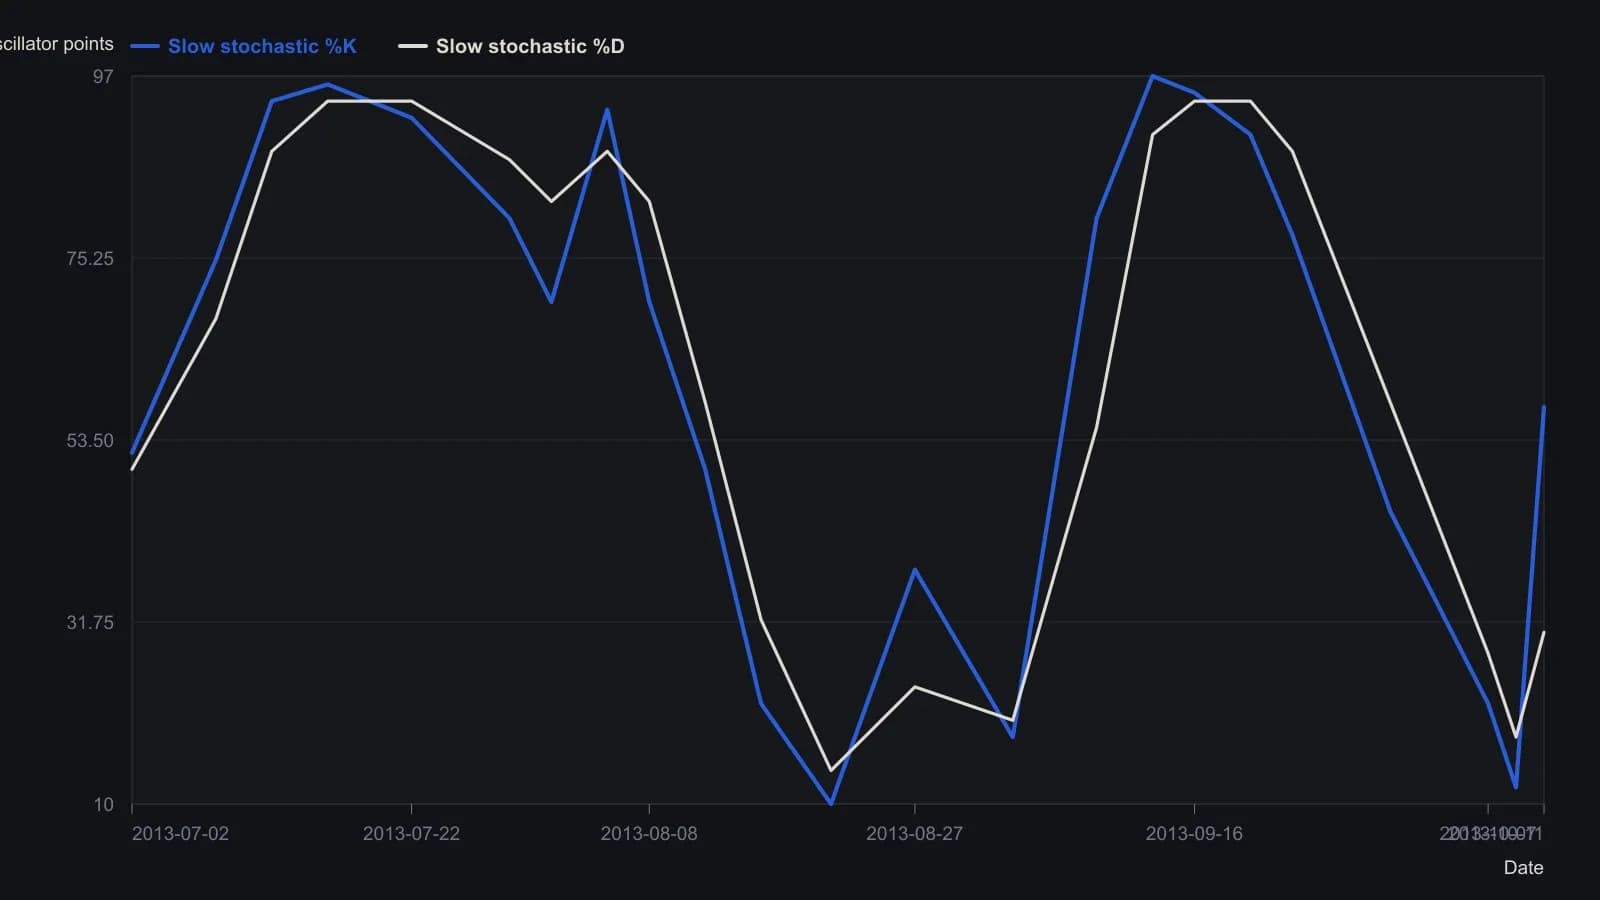
The pane is a 14-day slow stochastic (High, Low, Close, smoothed 3,3) on daily SPY bars, with 20/80 guide levels. Kaufman wants a 10–20 point swing between successive peaks or troughs before calling the formation clear, and notes that packing three textbook examples into one window is uncommon.
Confirm across several short windows
Multi-window confirmation uses several nearby slope lengths at once so a single noisy window cannot authorize an entry or force an early exit. A more robust version enters when at least two of three slope windows, or at least one-third of a tested range, show the same directional conflict and none show the opposite. That predefined count, with no opposing window, is the rule-based entry. The procedure then allows an initial adverse move.
Take the price trend through the pause
After the rules are written in advance, the constructed procedure follows the price-slope direction through the pause, on the premise that many chart compressions continue the prior trend. That choice is trend-resolution: take the prevailing price-slope direction when a divergence appears, instead of fading price because momentum disagrees.
Bound size before the order
Volatility position sizing sets share or contract count from a fixed cash amount divided by a recent price or volatility unit so each new trade starts with a comparable exposure. Stock size is a fixed cash amount divided by the prior session price. Futures size is a fixed cash amount divided by the dollar value of a 20-day average true range.
Keep the exit and time spent flat in the same procedure
The coded exit fires when every tracked price slope and every tracked momentum slope point the same way, covering or reversing on the next session open. Flat-time control leaves the market when slope combinations no longer justify a position, so exposure is intermittent rather than continuous.
Construction lessons
Construction lessons include confirming with several signals, taking equal dollar risk on each trade, and using time spent flat because discontinuous shocks cannot be scheduled.
All readings on this track · 25 readings
- 1988Two-sided optimization for volatility-scaled breakout rules
- 1990Weekly range volatility as a tactical regime filter
- 1993Heat first, then contract count on a weekly close-only breakout
- 1994Shared sigma for trend entries, retests and stops
- 1995The promised result as one testable trading procedure
- 2001Convert a survival ceiling into a volatility filter
- 2002Bound the next loss before the bear trade
- 2004Dollar-loss tolerance versus percent-of-equity stops
- 2004Bounded risk before entry: stop, size, and leverage
- 2006Position sizing as the pre-trade bound on loss and exposure
- 2006A trend-regime matrix for volatility position sizing
- 2011A premarket range checklist for opening-hour breakouts
- 2011Stop-defined share count on a clustered intraday short
- 2012Mechanical system design with strategy, signals, and size
- 2012Precommit size before a one-day policy shock
- 2013R-multiple expectancy, drawdown, and volatility position sizing
- 2014Constructing trend-aware slope-divergence rules
- 2014Pretrade drawdown fences and volatility sizing
- 2015Convert pip value into cash before a forex lot size is chosen
- 2016Expectancy as an execution skill rather than a backtest score
- 2017Volatility parity equalizes the ticket; implied volatility is a regime dial
- 2018Wide-range breakout rules from chart volatility
- 2019A structure-based stop, then resize or pass
- 2020A cash rule that zeros a trend book on extreme volatility and a short losing window
- 2025R-multiples before you size up